
Almost two in three farms have diversified, say Defra
 © FLPA/Rex/Shutterstock
 Almost two-thirds of farms in England have diversified into a non-agricultural business, generating a total of £620m in extra annual income, according to statistics released by Defra.
At 64% of farms canvassed in Defra’s Farm Business Survey 2016-17, the proportion of diversified farms had risen by 2% on the previous survey, carried out a year earlier.
See also: All you need to know about diversification
There are now 36,600 farms making a total of £620m from diversified activities which represents an 8% increase in income from £580m in 2015-16.
Total diversification income accounted for almost a third (29%) of the £2,160m generated from all farming activity in England.
Varied income
On average each farm made £17,100 over the 12 months but the proportion of income varies widely from farm to farm, Defra pointed out.
For 41% of farms with a diversification, the revenue accounted for more than a quarter of their total income. And on 27% of the farms the diversified business contributed more than the core farming income itself.
The most common form of diversification uncovered by the survey was letting empty buildings for non-agricultural use. About 24,600 or 43% of all farms in England are engaged in the activity. This type of venture also brought in the highest average extra income of £17,900 for each farm.
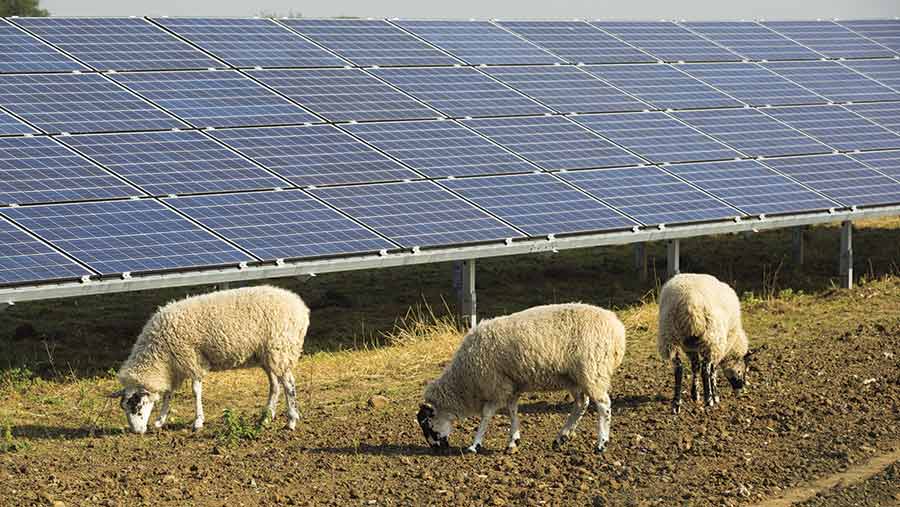
Energy
The next most popular non-farming business was solar energy.
More than 11,000 farms, about one-in-five, generated electricity from solar energy. But in terms of income it contributed the lowest amount (£2,400 per farm) of all diversification types.
However, when diversification is compared in terms of output, rather than income, the total contribution is less impressive.
Overall the output of non-agricultural business on farms was £1.19bn only 8% of England’s total farming production which stands at £15.67bn.
Measured in terms of output per farm, processing and retailing ranked highest with an average of £27,900 per farm, above lettings at £24,600.
Income from diversified enterprises —England 2016-17 |
|||||
|
No of farms |
Percentage of farms |
Total farm business income £m |
Income from diversified business £m |
Average enterprise income £/farm |
|
|
Diversified enterprises (all kinds) |
36,600 |
64% |
1,690 |
620 |
17,100 |
|
Letting buildings for non-farming |
24,600 |
43% |
1,330 |
440 |
17,900 |
|
Processing/retailing of farm produce |
5,200 |
9% |
170 |
50 |
9,700 |
|
Sport and recreation |
7,200 |
13% |
360 |
30 |
3,600 |
|
Tourist accommodation and catering |
3,400 |
6% |
150 |
20 |
7,000 |
|
Solar energy |
11,100 |
20% |
620 |
30 |
2,400 |
|
Other renewable energy |
5,200 |
9% |
300 |
20 |
4,600 |
|
Other diversified activities |
4,700 |
8% |
250 |
30 |
6,900 |
|
Source: Farm Business Survey, England |
|||||
Increasing number of farms with a diversification enterprise |
|
|
2010-11 |
52% |
|
2011-12 |
53% |
|
2012-13 |
56% |
|
2013-14 |
58% |
|
2014-15 |
61% |
|
2015-16 |
62% |
|
2016-17 |
64% |
Diversification defined
Defra’s survey excluded any agricultural enterprise even if it was a contracting venture carrying out work for other farmers. Instead its definition was any non-agricultural work carried out on- or off-farm that made use of the farm’s resources.