
Expansion for eggs and meat despite feed costs
The fortunes of everyone involved in eggs and poultry have been dominated lately by the cost of feed.
For three successive years, the profitability of egg and poultry production has slipped, as rising feed costs have given the industry a battering.
Despite these setbacks, both the egg and poultry sectors have continued to expand during the current year, although the egg sector, especially free range, has been hit much harder financially.
Broiler producers in particular have contracts linked to feed costs which provide some protection, but free-range egg producers have experienced a crippling fall in margins which has threatened the future of the industry.
Against this background our annual Facts and Forecasts feature takes a detailed look at the trends and outlook for the industry. Figures going back 10 years are tabled for all sectors of the egg and poultry industries, and analysed for clues as to what may lie ahead.
Egg sector
This year was always likely to be a dangerous one for the egg sector.
The transition of egg production across most of the Continent from one form of production to another with the arrival of the conventional cage ban on 1 January, was a massive challenge.
Add to that thousands of producers and packers making individual predictions and decisions across Europe, and stir in one of the sharpest rises in feed costs ever experienced, against the background of an unexpectedly protracted recession and the stage is set for chaos and potential ruination.
The egg sector has gone from glut to shortage and back into reasonable overall balance since the start of 2011, but at no time during that period have returns been favourable.
In fact the start of the sector’s problems can be traced back to early 2010.
The chars below shows a simple ratio of producer prices to feed costs for free-range production. The numbers on the chart are not standardised values, but indicate how relative profitability has changed over six years, with a higher number being better.
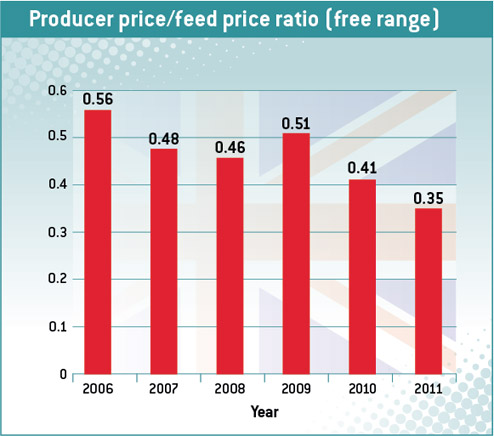
They show that 2009 was the last year in which returns in free range were comparable to their traditional level: since then they have subsided dramatically, reaching an all-time low last year.
Making the same calculation for the first three-quarters of this year shows that margins over feed have remained level with 2011.
Although there has been a significant rise in average producer prices this year compared with the same period of 2011, this has only matched the additional rise in feed costs since the start of this year and done nothing to address the already parlous state of the industry.
Returns at this level are viewed as unsustainable in the longer term and provide no margin for essential investment or to cushion against the setback from a poor flock.
Two principal factors have trapped producers in this position: the ever-rising cost of feed and the level of supplies, setting aside the temporary acute shortage last spring, the latter undermining any hopes of achieving much-needed price increases from the major retailers.
The pressure on the industry from feed costs cannot be overstated. The chart includes the cost of a basic layers’ ration according to Poultry World‘s formula. Since 2006 it has doubled, firstly rising to a peak in 2008, which at the time was considered to be impossibly high.
Then, after a brief dip, the price of feed set off again on a four-year run which, averaged for the first 10 months of this year (not shown in the table), has taken the Poultry World home-mix ration above £250/t. The “spot” price in July reached £302/t, and stood just a little lower, at £273/t, in October.
There is little belief among traders that pressure from feed costs is likely to improve by much in the medium term. Global demand for wheat, maize and soya is becoming more intense, with demand from China an ever-present factor with a deepening pocket to buy imports. There is no fresh land that can be cultivated, except possibly in South America, and climate problems are a recurring issue around the world affecting harvests.
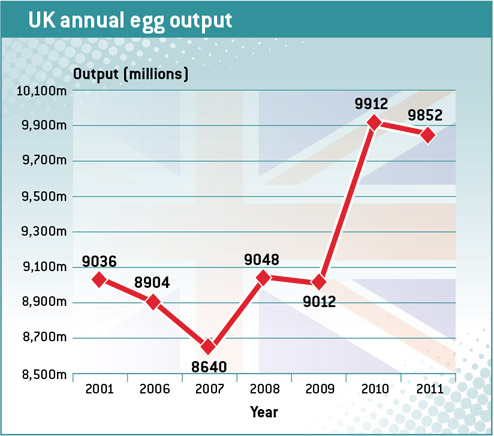
On the egg supply side, the egg output chart opposite shows how it all started to go wrong.
A surge in production in 2010 began when producers were encouraged to expect a rise in demand for free-range eggs in the run up to the cage ban, reinforced by plenty of farmers eager to find ways to diversify.
Producers eventually started to reduce chick placings in 2011, leading to a fall in packing station throughputs in the second part of the year.
Output continued to fall during the first half of 2012, leading to the very tight market in the second quarter. This was principally the result of the final departure of existing conventional cage units.
However, this was not long-lasting enough to achieve a substantial price rise from the big retailers, and in the third quarter the level of egg production began rising again.
This increase has been due to the completion of yet more free-range units that were in the pipeline before the troubles in the sector became so intense, together with the completion of colony units that were required to replace the outgoing cages.
All of these problems have been intensified by the prolonged nature of the recession, which has increased demand for intensive eggs and caused an unexpected fall in demand for free range for the first time in many years.
Organic producers have been hit especially hard and during the first nine months of the year, packing station throughput was down to around 170,000 cases a quarter, compared with 250,000 at this sector’s peak in early 2010.
The market remains seriously out of balance. Throughout this year, free-range eggs have been “cascaded” down into the intensive sector to match overall supply with demand, and to dispose of the free-range surplus. Now that more colony units have come on stream, the fate of free range has become uncertain, and the outlook for any improvement to prices looks bleak.
Chick placings have shown an overall rise for 2012 to date, with the biggest rise in the third quarter, of almost 11%. This gives an overall increase for January-September of 6.5% compared with the same period of 2011, and has led John Retson, the outgoing chairman of the British Free Range Egg Producers Association, to describe the probable impact on egg supply as “frightening”.
Recently, NFU poultry board chairman Duncan Priestner warned the industry that the good times were ending in free range and that the industry had moved from a young one to a more mature one. He said there were “tougher times ahead” and producers could expect more ups and downs in the future.
Poultrymeat
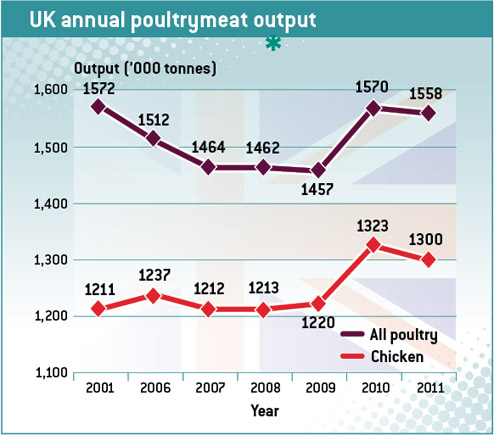
Some 10 years after poultrymeat production in the UK reached its all-time high, the industry is poised to set a new record this year.
Soaring feed costs, competition from low-cost producing countries and – in the case of broilers at least – lacklustre producer prices, have not stifled the continued growth in both chicken and turkey output.
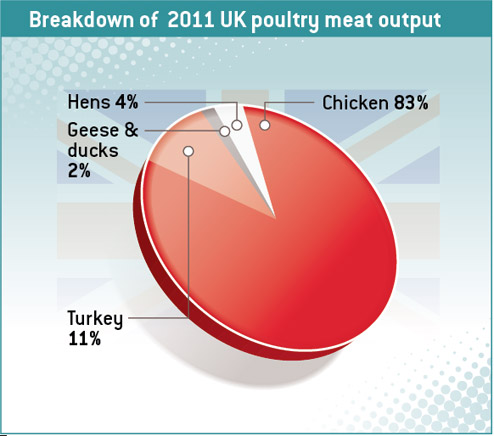
These two sectors comprise the chief elements of the poultry industry, and combined account for 94% of production (see chart above).
Back in 2001, the entire UK poultrymeat industry produced 1.57m tonnes, which at the time became the high water mark after years of steady growth.
After that, broiler production stagnated while turkey output experienced a significant decline (see middle left chart above and Table 2 on next page). The result was an eight-year overall decline in home production which finally bottomed out in 2009.
In the following year, 2010, broiler output rose by 8% and the turkey sector recorded the first annual increase for at least a decade.
In 2011, broilers paused again while turkey expansion continued, while the trend this year has been for solid growth in both sectors.
Chick placings for commercial broilers have risen by over 2% in the first nine months and those for poults are up by an impressive 6.3% overall. In the case of turkeys, the rate of expansion in day-old numbers has been very consistent at around 6% throughout the year.
According to latest DEFRA figures for tonnage of carcass meat, there is a marked move to heavier birds in the turkey sector with output in the first half of the year up by 19%, compared with the 6% or so for placings.
If the trend is maintained until the end of the year, combined chicken and turkey output in the UK is set to exceed 1.5m tonnes for the first time ever.
All this has been achieved in the same two years that feed costs have also set new records, and indicates the strength of demand for home-produced chicken and turkey, despite the price attractiveness of imports, which have also been rising strongly (Table 2).
Unlike the egg sector, producer prices for broiler producers have risen each year since 2006 (Table 2).
Over five years the rise in producer prices has been nearly 40p/kg, but slowing to nearly 10p/kg for the two years 2009-11.
The latest producer price increases have not kept pace with feed cost rises, and so profitability, measured as the ratio of feed costs to returns, was at its highest level in 2009. Even so, margins over feed are still comparable to those experienced in 2007, and it appears that poultrymeat producers are still confident enough to support the continuing growth in output.
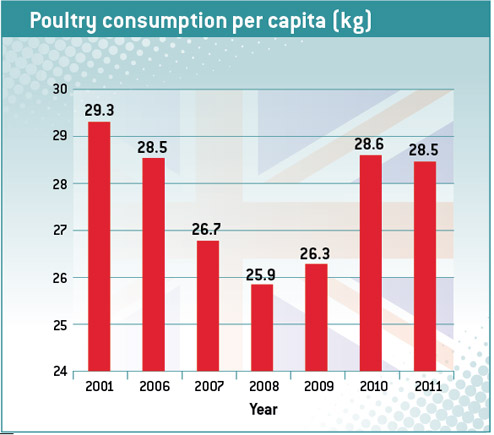
In spite of the recent expansion, per capita consumption of poultry is now lower than 10 years ago.
The relentless growth in the UK population has had the effect of amplifying the drop in production from 2001 to 2009, so that annual consumption per head fell from 29.3kg to a low of 25.9kg in 2008 (see chart on previous). More recent expansion has succeeded in reversing this decline in consumption, but the 2011 figure of 28.5kg has not recovered to the 2001 level.
1. United Kingdom egg supply balance (millions) | |||||||
| 2001 | 2006 | 2007 | 2008 | 2009 | 2010 | 2011 |
Output for human consumption | 9,036 | 8,904 | 8,640 | 9,048 | 9,012 | 9,912 | 9,852 |
Sold in shell | 7,212 | 6,648 | 6,480 | 6,924 | 7,164 | 8,076 | 7,968 |
Processed | 1,824 | 2,256 | 2,160 | 2,124 | 1,848 | 1,836 | 1,884 |
Imports* | 1,236 | 2,040 | 2,460 | 2,640 | 2,700 | 2,580 | 2,340 |
Exports* | 120 | 216 | 204 | 288 | 228 | 252 | 264 |
Total UK egg offtake* | 10,152 | 10,728 | 10,896 | 11,400 | 11,484 | 12,240 | 11,928 |
Imports as % of offtake* | 12.2 | 19.0 | 22.6 | 23.2 | 23.5 | 21.1 | 19.6 |
* Includes products | |||||||
|
|
|
|
|
|
|
|
United Kingdom’s egg industry | |||||||
| 2001 | 2006 | 2007 | 2008 | 2009 | 2010 | 2011 |
Chick placings (m) | 30.6 | 29.8 | 31.4 | 31.1 | 33.9 | 34.5 | 32.2 |
Layers (June) | 29.9 | 28.6 | 27.3 | 25.9 | 26.8 | na | na |
Growing pullets | na | na | 8.9 | 9.3 | 8.4 | na | na |
Total layers + pullets | na | na | 36.2 | 35.2 | 35.2 | 37.5 | 38.4 |
Imports of shell eggs (m) | 783 | 1,072 | 1,416 | 1,574 | 1,676 | 1,502 | 1,337 |
Exports of shell eggs (m) | 52 | 139 | 147 | 221 | 156 | 205 | 232 |
Imports of egg product* | 458 | 972 | 1,047 | 1,069 | 1,024 | 1,075 | 1,013 |
Exports of egg product* | 63.3 | 81.7 | 55.3 | 68.6 | 65.4 | 45.6 | 49.0 |
Packing station throughput (m): | |||||||
Cage | 6,068 | 5,419 | 5,236 | 5,182 | 4,840 | 4868 | 4,726 |
Barn | 593 | 443 | 337 | 333 | 373 | 480 | 387 |
Free range** | 1,958 | 2,355 | 2,409 | 2,880 | 3,289 | 4062 | 4,277 |
Organic | na | 431 | 491 | 489 | 360 | 334 | 302 |
Total (m) | 8,619 | 8,648 | 8,473 | 8,884 | 8,862 | 9,744 | 9,692 |
Consumption/head (No.) | 172 | 177 | 179 | 186 | 186 | 197 | 191 |
Average producer price (p/doz) | |||||||
Cages | 34.5 | 37.1 | 43.3 | 52.8 | 55.4 | 53.6 | 53.9 |
Barn | 46.6 | 51.5 | 55.8 | 70.6 | 72.7 | 72.2 | 72.6 |
Free range | 59.7 | 67.9 | 77.8 | 89.8 | 90.2 | 84.4 | 83.1 |
Organic | na | na | na | na | na | 135.6 | 131.6 |
Basic layers ration | na | 121 | 163 | 195 | 181 | 205 | 238 |
Egg/feed price ratio (free range) | na | 0.56 | 0.48 | 0.46 | 0.50 | 0.41 | 0.35 |
*Shell egg equivalent (m) | |||||||
** Includes organic until 2006 | |||||||
|
|
|
|
|
|
|
|
2. United Kingdom poultrymeat supply balance | |||||||
2001 | 2006 | 2007 | 2008 | 2009 | 2010 | 2011 | |
Poultrymeat | 1,572 | 1,512 | 1,464 | 1,462 | 1,457 | 1,570 | 1,558 |
Imports | 346 | 451 | 461 | 406 | 420 | 475 | 514 |
Exports | 186 | 233 | 293 | 279 | 253 | 268 | 290 |
Total UK offtake | 1,732 | 1,730 | 1,632 | 1589 | 1,624 | 1,777 | 1,782 |
Imports as % of offtake | 20.0 | 26.1 | 28.2 | 25.6 | 25.9 | 26.7 | 28.8 |
Consumption/head kg | 29.3 | 28.5 | 26.8 | 25.9 | 26.3 | 28.6 | 28.5 |
|
|
|
|
|
|
|
|
United Kingdom’s poultrymeat industy | |||||||
2001 | 2006 | 2007 | 2008 | 2009 | 2010 | 2011 | |
Broilers | 1,211 | 1,237 | 1,212 | 1,213 | 1,220 | 1,323 | 1,300 |
Slaughterings (million) | 787 | 815 | 808 | 795 | 807 | 870 | 863 |
Consumption/head (kg) | 24.1 | 24.9 | 23.4 | 22.7 | 23.2 | 25.5 | 25.2 |
Placings (millions) | 830 | 851 | 842 | 828 | 844 | 904 | 896 |
Producer prices (p/kg dw) | 71.0 | 71.9 | 77.4 | 97.5 | 101.3 | 104.0 | 110.6 |
Turkeys | 260 | 178 | 165 | 160 | 157 | 162 | 167 |
Slaughterings (million) | 26 | 18 | 16 | 16 | 15 | 16 | 17 |
Consumption/head (kg) | 4.4 | 2.9 | 2.7 | 2.6 | 2.5 | 2.6 | 2.7 |
Placings (millions) | 26.4 | 17.1 | 15.9 | 16.9 | 15.5 | 15.7 | 16.9 |
Ducks + geese | 50 | 44 | 38 | 35 | 32 | 31 | 35 |
Slaughterings (million) | 22 | 19 | 17 | 15 | 14 | 14 | 15 |
Hens | 50 | 53 | 52 | 56 | 50 | 53 | 56 |
Slaughterings (million) | 32 | 34 | 34 | 36 | 32 | 34 | 36 |
Keep up with the latest poultry industry news