
Farmers advised to allocate machinery spending better
 © Tim Scrivener
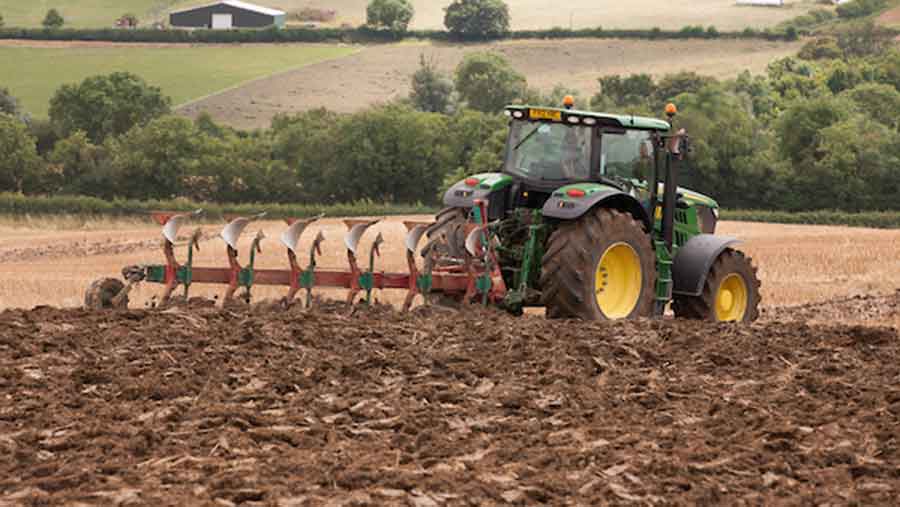
 UK farmers are spending too much on equipment, warns farm business consultant Andersons.
While the financial results from harvest 2017 are turning out better than many anticipated, this must not be seen as a reason to relax the scrutiny on investment, says the firm’s head of business research Richard King.
UK farms were carrying a machinery and equipment depreciation charge of £153 on every productive hectare in 2016, representing a 23% real terms increase in 10 years.
See also: Dispersal sales on the rise as farmers restructure operations
“Although agricultural equipment prices have risen in that period, the level of spending is too high,” says Mr King.
The latest UK tractor registration figures show 769 units larger than 50hp registered in November 2017, a 28.8% increase on the figure for November 2016. Between January and the end of November 2017 there was a 5.8% rise, to 10,673 units.
The prospects for the 2018 harvest year look favourable, despite some cost inflation, although not as good as for 2017, according to Andersons’ Loam Farm model.
This shows a business margin of £235/ha after BPS income and private drawings, compared with a provisional figure of £314/ha for the 2017 harvest year.
While the replacement of large items such as combines and tractors is often given more thought than for smaller pieces of kit, farmers often fail to consider alternative structures such as contracting and joint ventures, especially when results improve, says the firm.
Expansion
Economies of scale are often not achieved through expansion, because the additional acres are often used to justify further investment in larger machinery, which adds to costs rather than reducing them and with long-lasting effects.
“Purchase decisions are often driven by the desire to avoid tax or the health of the bank balance rather than the fundamental requirements of what the business needs,” says Mr King.
High land costs through Farm Business Tenancies (FBTs) or rent equivalents on Contract Farming Agreements (CFAs) are also damaging financial performance. The justification for these is often highly dubious and based on illusory economies of scale, says Mr King.
This can lead to a production treadmill, where higher yields are being chased to cover increasing costs but for many, a fundamental review is needed.
Prospective tenants and contractors must do their calculations prudently, says Mr King. “If this means walking away from opportunities, and letting others be ‘busy fools’, then so be it.”
There are opportunities for improvements in productivity, and therefore reductions in the costs of production, in all sectors, says Andersons.
“There is no need to wait until the effects of Brexit begin to bite to start this process. The biggest determinant of business profitability is how the business itself is set up and operated.”
Andersons’ advice
- Power and machinery costs (including depreciation, repairs, oil, fuel) – as a rule these should not represent more than 15-20% of output before subsidy
- Labour costs – should not be more than 15-20% of output before subsidy
- Take land on – but be very disciplined about not scaling up kit next time it needs replacing
- Take on more land – but let someone else take the cost, effort and depreciation, for example by using contractors
- Increased specialisation can bring increased risks
- Grants – make use of the many opportunities for business efficiency and diversification and other capital grants
- Milk – evaluate your milk contract and production system – seemingly minor improvements can bring significant efficiency increases
- Grazing livestock – sector tends to concentrate on output prices too much – instead, maximise grazed grass contribution, minimise housing costs and focus on producing to specification.
Loam Farm model(600 ha combinable crops – milling wheat, oilseed rape, feed wheat and spring beans) |
||||
|
|
Harvest years |
|||
|
£/ha |
2015 (Result) |
2016 (Result) |
2017 (Provisional) |
2018 (Forecast) |
|
Output |
1,048 |
1,061 |
1,215 |
1,161 |
|
Variable costs |
431 |
421 |
395 |
408 |
|
Gross margin |
617 |
640 |
820 |
753 |
|
Overhead costs |
404 |
394 |
414 |
418 |
|
Rent and finance |
243 |
242 |
243 |
242 |
|
Drawings |
75 |
77 |
77 |
77 |
|
Margin from production |
(105) |
(73) |
86 |
16 |
|
Basic payment |
179 |
213 |
228 |
219 |
|
Business margin |
74 |
140 |
314 |
235 |
|
Source: Andersons |
||||