Buying a tractor? How to make sense of engine statistics
 © Cummins
 Hands up who knows the difference between a tractor’s rated and maximum power? Or what the perfect torque curve should look like? How about torque rise? Or six-point fuel tests?
If this mumbo-jumbo gets your head in a spin, then fear not. Over these pages we’re going to explain exactly what you should be looking for in the engine statistics of the tractor you’re eyeing up.
Which power statistics?
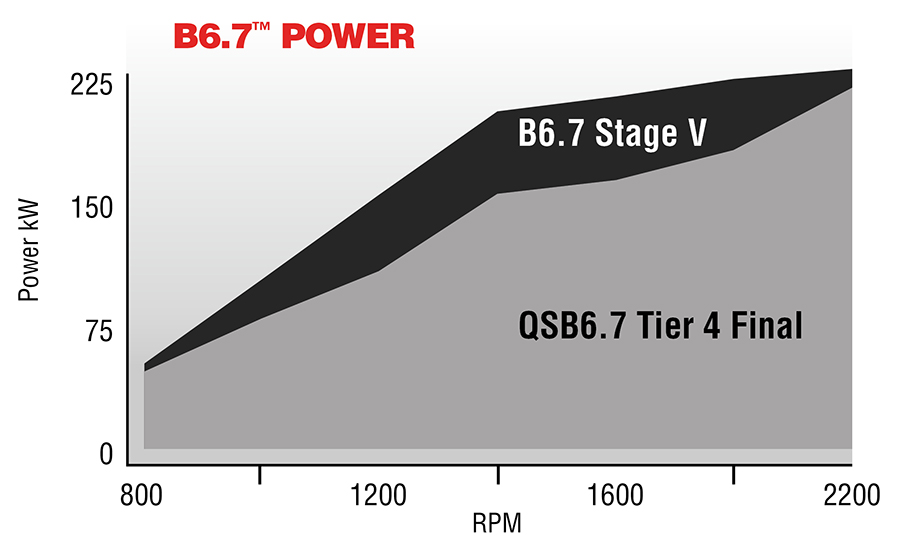
There are two different figures to consider here, the simplest of which is rated power. This appears on the torque curve at the maximum rated engine speed and is the power available when the crankshaft is spinning at its fastest.
The second is maximum power and is the highest achievable power at any engine speed. This can be the same as the rated power (if the peak of the curve occurs at the rated engine speed) but, on tractors, is likely to occur some way before that – normally 100 to 300rpm below rated speed.
To add a touch of extra confusion, there can be another list of rated and max power figures that relate to a second programmed torque curve. This is usually referred to as the boosted power, which is only available for certain applications.
See also: Tractor test: Six 120hp tractors go head to head
What is boost?
Boosted power is a relatively new thing. It’s where two (or more) different torque curves have been programmed into the engine’s computer.
One of those will have a higher maximum power or torque, but will only be available under certain conditions. Most commonly, it can be accessed during high-speed transport work and when running the PTO.
Why? The limitations of the standard torque curve – which is usually de-rated by engine makers to suit the machine it is fitted to – are set to protect the weakest link in the driveline from being subject to loads that it isn’t designed to cope with (think transmission, axles or clutch).
A good example is the field mode available on a lot of modern tractors for low-geared cultivations. Making the boost-badged torque curve available here would send far too much torque through the driveline for the other components to be able to cope with (long term, anyway).
Basically, boost allows tractor-makers to give operators more power by pushing the engine closer to its limits, but only where it’s safe to do so.
Same standards
Thumb through any tractor spec sheet and you’ll see several power ratings that are based on different ISO global and European measuring standards.
These vary depending on how the different figures are measured. Some require the alternators, fans and other ancillaries to be fitted; others just consider an engine’s gross torque without deductions, which could be up to 10% higher.
If you’re picky then the one to look at is net torque (it takes frictional losses in the engine into consideration) as this gives a good idea of real-life performance at the flywheel.
Tractor companies tend to pick whichever figure makes their machine look the best, which is usually the top parent torque curve (the boost curve). In reality, it doesn’t matter which one you base your decision on – it’s more important that you compare figures based on the same standards.
Ideal torque curves
Designing a new engine starts by drawing the ideal torque curve, which will vary according to its intended end use.
This parent torque curve simply sets the highest performance of a particular engine and could have about 20 subsequent versions that are programmed to max-out at lesser figures.
These help to make sure the tractor works within the limitations of its other components or reduce fuel consumption in pre-set modes, such as ‘eco’.
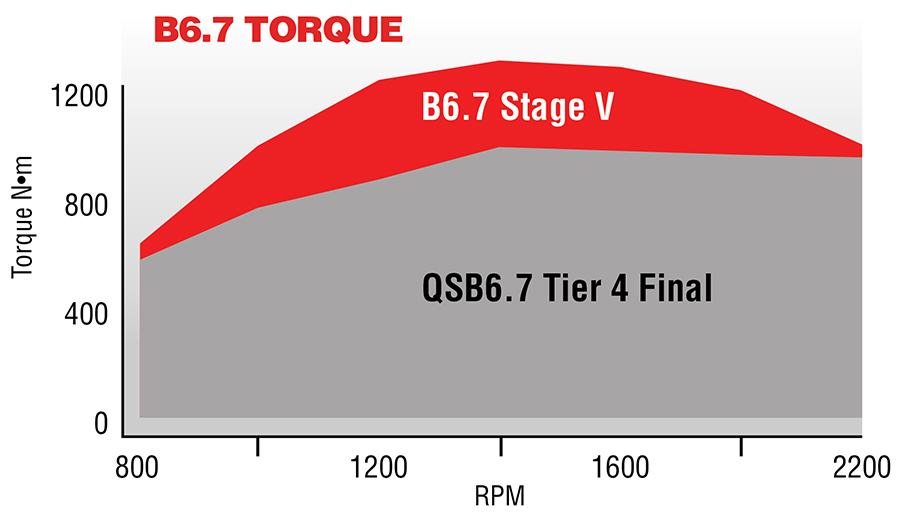
Every different version of the torque curve has to be certified and emissions tested before it can be made available and displays things like peak torque and torque rise, which are both key attributes of a tractor.
Torque rise is the difference between peak torque and the torque at rated power; hence the rate at which the torque increases as the engine speed slows. There’s nothing complicated here – it’s just a case of the bigger, the better – but a figure of 35-40% is pretty healthy.
If, for instance, you’re cultivating and hit a rough patch, a tractor with good torque rise can be dragged down from its rated rpm to peak torque without stalling or needing to drop gears.
Comparatively, if it can’t hang on and maintain speed then the tractor will lose momentum, the engine rpm will shoot up and so will the fuel consumption. The same rule applies for road work with a loaded trailer – without torque rise, the engine would lose speed on a hill more quickly and, without gear changes, stall.
Torque curves of automotive vehicles tend to have flatter tops. The shape of the curve is closely related to drivability, so off-highway machines suit a peak that stops the engine sinking when the going gets tough.
Low-end torque
The other figure to consider is low-end torque, particularly for road or loader work. It is the baseline torque – the engine’s force at tickover speed – and dictates how easily the tractor pulls away from a standstill.
The key to this (in the construction of the engine, at least) is matching the turbocharger performance to the engine.
The amount of torque is determined by the quantity of fuel delivered to the cylinders and the aim is to ram as much diesel into the cylinders as possible (while making sure the air-fuel mix ratio, compression ratio and timing is correct).
So, the greater the air density in the cylinders, the more combustion of fuel and torque available.
The size and design of the turbo depends on the intended end use of the engine. A combine, for instance, can afford to have a bigger turbo that takes longer to spool up as it doesn’t need to respond so quickly to a heavy load at low rpm compared with a tractor.
How to measure fuel consumption
Fuel consumption is notoriously difficult to predict as far as tractors are concerned. Every farmer has a slightly different use for their machine and there are so many variables in play, including weather, implement and the load on the tractor.>
To get a good guide, it’s best to work out the mix of work you’re likely to be undertaking. The independent DLG testing station provides fuel consumption stats for most tractors that give a flavour of its efficiency at different speed and load points.
Steady state figures – where the engine is running at a pretty constant speed – tend to be calculated in g/kWh, which is the measure of the number of grams of fuel used to produce 1kW for an hour.
This allows for the comparison of different sized tractors and is measured at the engine flywheel, the PTO or at the drawbar depending on the type of test.
The commonly referred to figure is the six-point load test, which sees consumption recorded at six steady-state (stable engine speed) points. These tend to be based on common operating speeds in the middle of the rev band and are a good basis to work from.
Engine-makers set an engine’s sweet spot at a point on the torque curve where it is likely to spend most of its time working. It’s here that operators will get the best combination of fuel consumption and power
Four-cylinders or six?
The decision between four- and six-cylinder engines is becoming more common as tractor-makers try to fit smaller, lighter-weight blocks that are able to provide stats comparable with six-potters.
The biggest downside of opting for a four is the reduced low-end torque. In simple terms, it comes down to the capacity to combust and the total displacement, so the bigger the engine volume and more fuel in the combustion chamber, the higher the low-end torque.
Manufacturers can partially offset this problem by tweaking the governor to predict heavy loads and rev up quickly in response.
Four-cylinders sometimes have less torque rise, too – mainly because of a lower peak torque figure. So, although the headline-rated power stats look similar, the torque curves tend to look very different.
Load factor – making the engine last
Engine longevity is often determined by the load factor, which relates to how hard it’s being worked as an average percentage of the torque it produces during its life.
A combine usually operates much closer to its limits and might have a 70% load factor, but only does a fraction of the work hours compared with a tractor where a 50% load factor is more typical.
The average load factor increases on smaller engines (so needs to be considered in the four- versus six-cylinder debate) but shouldn’t actually make a whole lot of difference – it’s probably still working well below its maximum.
How clean are new engines?
The latest round of emissions constraints on tractor engines has led to the launch of new generation Stage 5 blocks.
Exhaust particulates are now measured by particle number count, rather than just weight, and have seen a real-world cut of well over 90% since the previous stage
Emissions challenges have seen most makers fit EGR kits, but these sap power as they try to run cooling systems that reduce the temperature of the returning gas.
Highly strung EGR systems don’t react well to high-sulphur content fuels either, which has implications when they’re flogged to less developed countries further down the line.
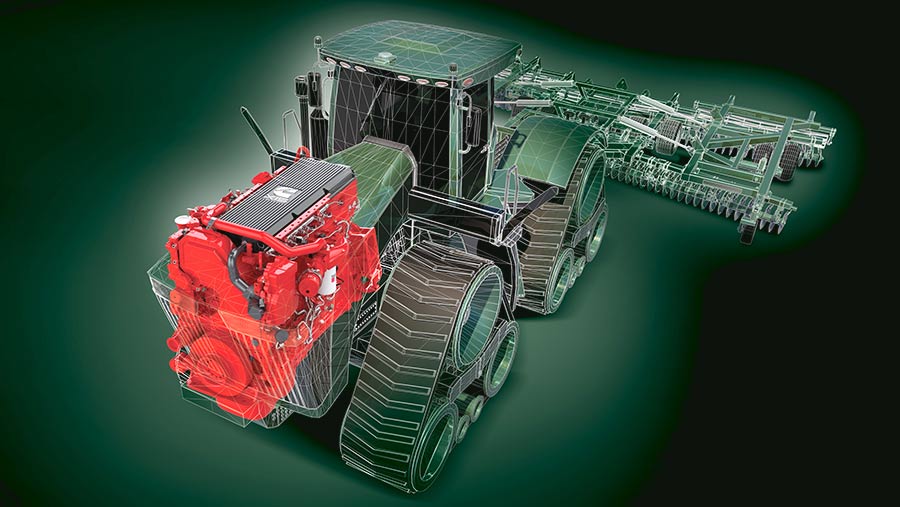
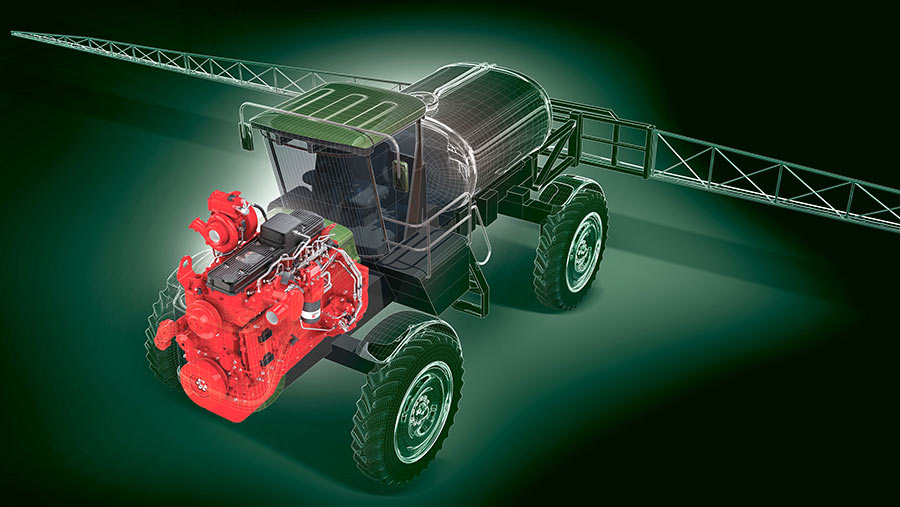
Surprisingly, Cummins has managed to buck the trend and strip its Stage 5 engines of EGR – opting for a combination of DOC/DPF/SCR – with all the emissions gubbins fitted in a single module.
And it’s done that without a power punishment. Its latest 6.7-litre engine has up to 30% more torque and, at 326hp, is more powerful too.
That is good news for tractor manufacturers that will be able to offer higher ratings from the same sized block or replace big nine-litre engines with a smaller one to cut the costs of purchase and ownership.
© Cummins
What about Stage 6?
There’s currently no push towards Stage 6, mainly because agricultural engines are now so close to zero on NOx and particulates that they’re hard to measure.
However, there’s a lot of industry chat about future regulations. Speculative guesses include a scrappage schemes for older machines (as seen in the automotive industry) or in-use monitoring of emissions that restrict performance when set levels are exceeded.
Equally, farm machinery could be classified according to its efficiency, with financial incentives for running low emissions or fuel-efficient kit.
What’s the future for diesel?
Diesel power is here to stay, although engine developers will be governed in some way by rules that limit emissions, improve fuel consumption or reduce the cost of ownership.
In the long term, engines are likely to become smaller, lighter, more efficient and have longer service intervals, particularly if manufacturers are able to develop them without the burgeoning costs of emissions development.
Lots of progress has been made in this department in other sectors. Take F1 cars, for instance, where ceramic materials in the pistons, bores and intakes mean they can work at far greater pressures. Of course, things will have to be produced more cheaply if they’re being used in agriculture.
Manufacturers have also ploughed a lot of time and money into researching renewable energy sources. Hybrid diesel/electric set-ups are the clear front-runner (although still a decade or so away from mainstream production in tractors) and use a battery pack as the main source of power with a small engine to top it up.
Full electrification is much less likely. Big batteries are prohibitively expensive and don’t have the capacity to fit inside tractors that run for 17 hours a day, not to mention the shortage of infrastructure required to deliver a good supply of electricity to farms for rapid charging.
Cummins engines – where they’re made
Cummins has maintained a strong reputation in agricultural circles. The company is based in Indiana but has 18 manufacturing sites all over the world, including engine divisions in Darlington and Daventry and a turbocharger factory in Huddersfield.
Last year, Cummins produced over 1.1 million engines in a range that runs from 2.8-litres and 55hp up to 95-litre blocks pushing out 4,400hp. That includes the ag-spec engines from 3.9 litre (75hp) up to 8.9 litres (400hp) that are built in Darlington and the 15- and 19-litre engines assembled in the US for John Deere and Versatile tractors.