Wheat quality measures under fire
Is bushel or specific weight a reliable indicator of wheat’s nutritional quality, and are grain sampling and testing procedures accurate enough to determine fallbacks? Sarah Henly finds out.
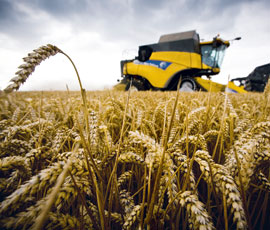
The widespread problem of low specific weight resulting from last summer’s appalling weather has brought several key issues into question, including the value of specific weight as a measure of grain quality.
Why are we still reliant on a test designed decades ago to measure grain volume simply for shipping purposes? Isn’t it and the equipment used to measure it far too crude for pricing decisions? And why, when research suggests specific weight correlates poorly with feed value, does it hold sway at all?
Evidence from HGCA-funded projects between 1997 and 2008 suggest a lack of relationship between specific weight and nutritive value of wheat in broiler diets. For other end uses, the picture is unclear, yet the industry continues to use specific weight as the basis for payments, says Peter Kettlewell of Harper Adams University College.
“The test has become entrenched because it is quick and easy, but everyone knows it is too general an indicator of grain quality. It reflects grain density and packing characteristics as well as size, and a low value may not render the grain any less valuable,” he suggests.
He acknowledges that poor feed performance can result when values dip below the mid-60s, a view substantiated by feed compounders. Typically pigs and poultry are less adaptable to variable grain quality than cattle and sheep, though there is little concrete data because levels generally reach 70kg/hl. Some samples are below 55kg/hl this year, according to the survey.
Final figures from the AHDB/HGCA Wheat Quality Survey 2012 are due later this month. But estimates (see right) put specific weight 8% down on the three-year average, the lowest in 35 years of surveys.
For the numerous growers with grain below the usual minimum specifications of 76kg/hl and 72kg/hl for milling and feed contracts respectively, it’s little consolation that current wheat prices are good. Some end users are being flexible about what they will take, but fallback levels can be shocking, says Guy Gagen, NFU chief arable adviser.
“The implications of low specific weight are currently unclear. There will probably be extra costs in processing and to supplement variable performance. However, I believe growers deserve explanations about changes to pricing before the grain leaves the farm.
“Broadly, depending on the process involved, there are functional reasons why specific weight makes some impact. Our members are mostly concerned about feed wheat, in particular for animal feed. Each fallback will relate to individual 29t parcels of grain, and the trade is well placed to communicate on these where there is concern over the extent of fallbacks claimed by the intake.
“It’s arguably an imperfect system. Penalty payment levels are changing by the day, depending on intake and contract agreements. Managing crops with very low specific weight in the remaining 2012-13 marketing period will require considerable effort from everyone in the wheat supply chain,” he warns.
In the cattle and sheep sectors, there’s a tenuous link between specific weight and livestock performance, says Mr Gagen. Pig and poultry feed compounders are currently testing poor samples for their starch contents and the knock-on effect on animal growth.
The challenge for the feed industry is to achieve a consistent product for livestock farming customers from very widely varying intake samples, says George Perrott, head of the feed sector at the Agricultural Industries Confederation.
“We are having to handle extreme variability in sample quality, perhaps the greatest variation in decades. Compounders can use consistently high or low specific weight material, but it wants to be consistent.”
Nabim trade policy manager Martin Savage says the milling industry is suffering in the same way, even within a single parcel of grain in a lorry or a store. He would like to see growers working hard at taking out screenings, cleaning and segregating crops.
“Some millers are facing nightmare situations where lorries are not turning up when expected because growers are trying to understand the fallback situation. We are used to having around 85% of our domestic wheat available for bread and this year only 6% met full breadmaking specifications.
“We have accepted we will have to use anything with a specific weight above 70kg/hl, with a consequent reduction in flour yield and colour. But we must pass on those costs.”
Does he think the current system using specific weight to assess grain for flour quality is good enough? It could be better, says Mr Savage.
“We know extraction rates are affected by inconsistency, though we don’t yet fully understand the reasons for performance variability. In an ideal world, we would have a rapid test to relate grain with flour characteristics. A test that shows the amount and quality of protein in each fraction of the grain would be useful.”
A PhD project by Jibin He at Rothamsted Research looking at protein distribution should help to guide millers in improving efficiency in the future. But there is a need for more funding for research of this type, he says.
Previous HGCA-funded work at the University of Nottingham showed no link between specific weight and nutritional value, though it didn’t evaluate levels in the 50s, acknowledges researcher Julian Wiseman. More recently, research has focused on wheat genetics, and indicates a tendency for softer wheats to be better nutritionally.
Mr Gagen wants to see further research leading to improvements to the current testing system.
“We are keen to encourage the development of a feed wheat quality measure that is more helpful, and to see appropriate technology in use at intakes. Chondrometer and moisture meter calibrations are critical when you think that a small inaccuracy can have such a large impact on profitability.”
Growers should be aware of the brand new British Standard (BS EN ISO 7971-2:2009) used at intakes to check the consistency of routine measuring instruments to estimate specific weight. It deals with samples that contain straw or chaff, which artificially lower test weights.
“It is one thing on a linear scale of £1 a point with claims applied only to that grain above 2% admix, but another altogether when fallback scales increase significantly in steps as specific weight decreases. If above 15% moisture, adjustments should also be made to bring the specific weight up.
“Inconsistency against the standards in analysis could bring a sample into much higher charges. With specific weight fallbacks on feed wheat reaching sometimes thousands per 29t load, the utmost care is justified,” he says.
Meanwhile, he urges growers to consult HGCA’s Cereal Sellers’ Checklist and take appropriate samples and sub-samples according to the HGCA Grain Sampling Worksheet, to get the best possible picture of the grain quality situation on-farm. If necessary, grain of different quality should be segregated.
Top tips
NFU advice on trading low specific weight grain:
- Check contracts to understand the end user’s quality specifications and any standard and/or special contract terms
- Talk to merchants rather than loading grain in the hope it will pass intake tests
- Challenge buyer’s results if you and your merchant hold sound evidence that grain is of higher standard than claimed at intake
- Calculate the anticipated costs of mitigation to benchmark against delivering grain subject to a level of claims
Tips to improve grain income
- Pass grain through a cleaner or seed dresser
- Blend with grain of a higher specific weight
- Approach storage co-operative or merchant about tonnages outside your bought storage commitment that could be blended or arrange farm storage collaborations