Computer-based tool helps reduce hidden farm costs
Labour and machinery costs are notoriously difficult to pin down and allocate to different areas of a farming business. But any grower serious about identifying and containing production costs needs to do both with a good degree of accuracy.
The number crunching this entails has just become a great deal easier, says Philip Dunn, head of agricultural business consultancy at Brown & Co.
He has developed a tool, aptly called the Labour and Machinery Costings Service, that reveals the cost of owning and running all kit and the cost of labour, including an assessment of non-productive hours that are often overlooked.
“Farmers and contractors can now assess and compare the true cost of their operations and crop production, something that most would have found difficult to do to this degree of accuracy,” says Mr Dunn.
The need for such detail is increasing, he believes. Labour and machinery represent the largest costs on most farms and machinery spending is spiralling.
“A few reasonable years in the arable sector has led to an explosion in machinery expenditure, fuelled by increases in annual investment allowance and above-inflation rises in machinery costs,” he says.
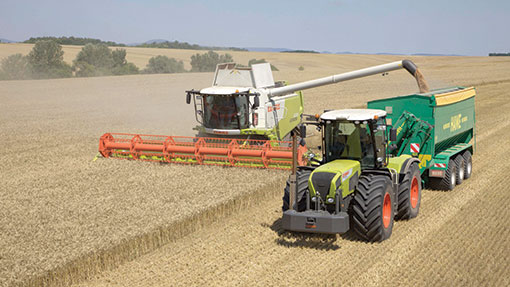
As well as analysing results using actual figures, the tool, which is based on a series of complex spreadsheets, can be used for budgeting. This provides a clear picture of the likely effect of switching machines or adopting new systems such as non-inversion systems or strip tillage, Mr Dunn explains.
“It has also proved very useful for contract farming operations, giving them a very accurate guide on how much they can bid for extra acres and still return a profit.”
HGCA monitor farmer Robert Atkinson, who farms 180ha of mixed soils at Adwick Grange, Woodlands, near Doncaster, and a stubble-to-stubble contracting agreement on a neighbouring 40ha, is into the second year of using the Labour and Machinery Costings Service.
While he thought he had a good grasp of his costs, the service showed that he had underestimated depreciation of key machinery.
“This can be quite difficult to tease out of the farm accounts and may not be calculated properly,” says Mr Atkinson. The spreadsheet showed depreciation accounted for about 50% of total machinery costs, emphasising how critical it is to nail them down, he adds.
The service also proved useful in budgeting mode. He had planned to buy a second-hand, self-propelled sprayer, but plugging in the predicted £30,000 cost showed depreciation and interest would be roughly double that of his ageing but perfectly serviceable sprayer.
The service also highlighted the potential effect of leaving his heavy clay land fallow in the spring of 2013 by loading the additional overhead allocations on to crops he had managed to establish.
He decided to grow spring beans to dilute those production costs – although that did not guarantee better profits, in this instance it added £8,000 to the bottom line, says Mr Atkinson.
The costings service also showed he was, at best, breaking even on a subsoiling and ploughing contracting operation, which he has now ceased. This was mainly due to the amount of non-productive time he had not recorded.
The level of unproductive time across the whole farm business accounted for about 30% of total available hours, a typical figure on many farms, says Mr Dunn.
Nevertheless, the labour profile showed that the amount of available labour – one full-time man and a day-release student as well as Mr Atkinson’s time – exceeded the farm’s need by a considerable margin almost year-round. As a result he has increased his bed-and-breakfast pig operation, which currently stands at about 1,400 pigs.
“I am also over-machined, so taking on more land might seem the obvious route to spread both these fixed costs. But extra land rarely comes up in this area and only at a very high rents,” he adds.
The figures suggest it would pay to use more contractors, especially when it comes to combining, says Mr Dunn. Although the farm shares an MF7274 with a neighbour, it is still not cheap to run. However, Mr Atkinson is reluctant to change. “We need the straw for pigs and prefer to cut it ourselves. Straw quality has a direct impact on pig health so we don’t want the whole area on the ground at once.”
Mr Atkinson says the service has proved invaluable in some important decision making.
“Overall we weren’t far away on most costs. But it revealed some important areas to focus on and has more than paid for itself.”
Labour and Machinery Costings Service: the nuts and bolts
Base data required for the Brown & Co service includes cropping areas, yields and total tonnages. Soil type is also recorded as an approximate percentage of light, medium and heavy land to determine the number of available labour days each month, according to a standard formula.
Other labour and machinery costs – those not allocated to specific operations and usually hidden in general overheads – are listed and costed from previous years’ accounts.
General statistics, such as grain store load-out rates, cost of funds, insurance costs, average hourly labour costs, average fuel costs, total repair costs for the crop year and base depreciation rate are recorded.
“None of this base data is too taxing,” says Brown & Co’s head of agricultural business consultancy Philip Dunn. “If the farmer has a good set of accounts we can collect it in 15 minutes.”
The next step is to record machinery data, specifying all major, minor and hired-in items, from main tractors and combines down to slug pelleters and guidance bars. “We start with anything with an engine and work through to anything that is not in the nettles.”
Year of manufacture and purchase dates are recorded and used to estimate starting values for the year. The base depreciation rate is then inputted to create actual depreciation cost for each machine for the year. Repairs can then be allocated as a percentage of capital value or specific amounts can be allocated to high-cost machines.
Interest on each machine’s value is charged, based on value at the start of the year multiplied by current cost of funds. Once insurance (as a percentage of capital value) is added on, the total cost is calculated, which can be expressed as cost an acre or hour.
The final inputting operation is to list operations done. “This is a list of all things with an engine and the equipment each is teamed up with during the year. We then put in work rate of each combination and fuel use.”
The area covered by each combination on every crop is then entered, as is all non-crop work, such as contracting work, crop drying or loading out.
All the information needed for the spreadsheet to calculate the most detailed costings is now loaded. Operation costs for every acre can be drawn up quickly, as can labour costs, including downtime, to provide a total cost an acre for each operation. The spreadsheet can also express this as cost a crop.
An accurate farm labour profile can also be constructed using a combination of hours worked to carry out the operations by month and allowing for downtime.
Although an enormous amount of data can be produced and accessed, the results can be expressed in several dashboard formats, which can be customised to each business.
“These highlight key data in a range of easy-to-interpret graphics,” says Mr Dunn. “This allows rapid assessment of the findings, which can be used to define performance and compare and benchmark with other businesses.”
The costings service can be set up in a few hours and can be updated very easily, says Mr Dunn.
“Many businesses have become too complacent when it comes to costs; for a few pounds an acre, this service allows them to look very hard at their cost structures, helping them to save money and remain efficient and competitive.”
Analysis provides a clear picture of the likely effect of switching machines or adopting new systems, says Philip Dunn.