
Benchmarking arable performance – where to start
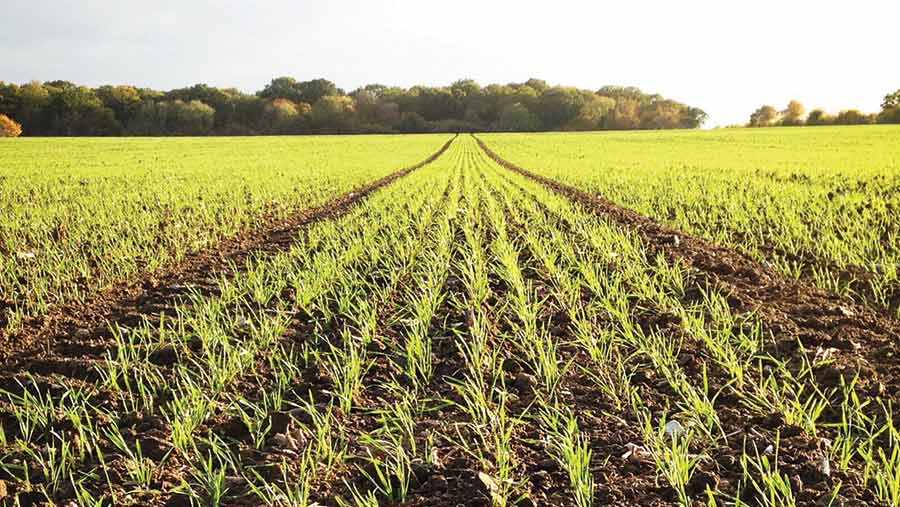
Understanding the financial and physical performance of your business is vital to make accurate management decisions and maximise profitability.
Benchmarking for the first time can be daunting given the array of information available, but Sentry’s rural business advisor Alec Smith says even relatively simple measures will reveal worthwhile information that may prompt more detailed analysis.
“Don’t get hung up on detail or worry about getting everything 100% right straight away. The important thing is to start somewhere and work up from there,” he says.
Benchmarking tips
- Keep it simple to start
- Be honest and open to advice
- Apportion costs correctly
- Look at results over several years
- Compare your results with others
Mr Smith highlights six key areas for arable farmers to focus on:
1. Seed, fertiliser and sprays
A traditional measure of variable costs on arable farms, this is a good way of checking expenditure on the main crop inputs is not too high.
Figures are generally easy to collate and costs can be calculated on an area basis (as below) or a tonne by dividing costs by average yield.
“Our costs were lower than many in 2017, which is mainly due to our buying strategy rather than using less. Benchmarking isn’t just about saving costs, but ensuring costs are proportional to output,” says Mr Smith.
See also: Key cross compliance and greening dates by region
Comparing costs on a field-by-field basis also helps evaluate whether poorer areas are costing too much for that level of output and whether it may be better to put another crop to use, such as environmental stewardship.
2. Fungicide cost/tonne
Another way of checking key input costs are in balance with output is to calculate total fungicide spend on a tonnage basis.
The average across Sentry’s wheat area last year was £11.40/t, but the top 25% spent £9.60/t.
Breaking information down to a block of land or individual field basis helps identify whether expenditure is proportional to yield.
“Some farms use the same fungicide strategy across one crop, but ideally it should be tailored to yield potential,” says Mr Smith.
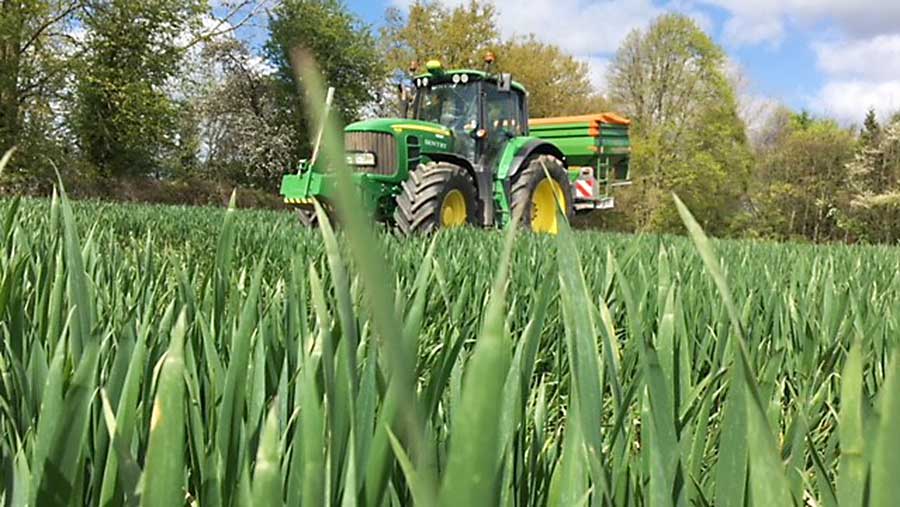
3. Labour and machinery costs/hectare
Labour and machinery costs can be the hardest to tackle, but must not be overlooked.
All aspects should be included, which for labour includes the cost of full/part-time staff, and a value for any family labour.
Machinery costs depend on the farming system, but typically include spares and repairs, fuel, depreciation, hire charges, service agreements, tax and insurance.
Average labour costs on Sentry farms in 2017 were £140-145/ha, with the top quartile nearer £110/ha.
Average machinery costs were £250/ha (see chart), down to £220/ha for the top performers.
Labour and machinery costs can be the hardest to tackle
4. Enterprising
For accurate benchmarking data, costs should be attributed to the appropriate enterprise to ensure nothing is missed or overestimated.
For example, if machinery or labour is used across arable and livestock enterprises, a representative proportion of that item’s total cost should be assigned to each enterprise.
Or, if contract harvesting 200ha alongside 200ha of your own land, only half of the combine costs would be attributed to the farm’s land, with the remainder against the contracting.
5. Look for data trends
Given the seasonality of farming, it is dangerous to base assumptions or decisions on just one year’s data.
Equally, it can be easy to make excuses for poor performance in a single season, so several years of data – at least three, preferably more – are needed before underlying trends can be seen and acted upon.
6. Input balance
One measure Sentry uses to compare its farms is to rank total variable costs and output with an ‘input balance’ percentage.
Costs are calculated for every farm on a per hectare basis, then each one is ranked from 0 to 100, with 0 representing the highest cost and 100 the lowest.
Output (yield x price) is also ranked, with 0 representing the lowest and 100 the highest.
Adding the two figures together should total close to 100% if expenditure and output are in balance (ie, high input, high output or vice versa).
A low figure indicates a potential problem – eg, costs are too high or output too low for that level of spend.
Benchmarking at Sentry
Sentry covers 16,300ha of arable land and has been benchmarking since 1988.
The company now uses the AHDB Farmbench service to collate data before analysing its own results, comparing them across Sentry farms and with the rest of the industry.
Farmbench is an online benchmarking system that allows farmers to enter whole-farm or enterprise-specific business data that can then be compared against others through aggregated and anonymised results.
It uses three broad performance indicators: financial information (eg, sales, costs and margins), technical data such as fertiliser use, and production data (eg, crop yields). Criteria can be on an area or tonnage basis.
Results are fed back to growers through discussion groups or individual reports.
Sentry average costs, harvest 2017 (£/ha) |
|||
|
|
Seed (inc home-saved) |
Fertiliser |
Sprays |
|
Winter wheat |
67.60 |
169.30 |
242.30 |
|
Spring barley |
74.10 |
133.50 |
142.40 |
|
Winter oilseed rape |
76.00 |
188.00 |
207.80 |