
4 popular carbon calculators for farms compared
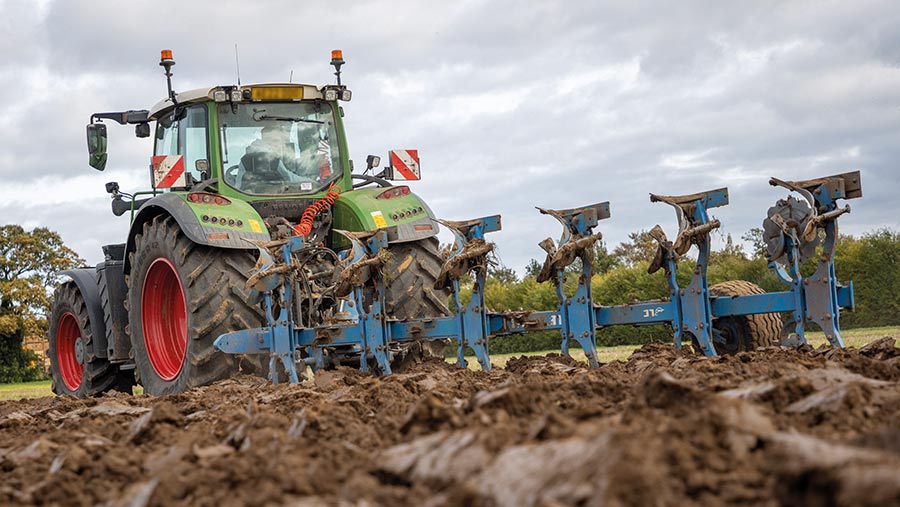 © Gary Naylor
 Strategies to improve the economic situation on a farm will very often result in also reducing your carbon footprint, which can make a carbon audit a useful benchmarking exercise for farmers.
Farms with a low carbon footprint are often the most efficient and profitable, subject to land use and type, and sector, says Simon Haley, director of consultancy firm Carbon Metrics.
The company helps farmers develop ecologically and financially beneficial carbon management plans.
See also: Carbon calculators – where do I start?
The starting point for understanding a farm’s carbon footprint is usually entering data into one of the many calculators that have been developed in the past 10-15 years.
Four calculators have emerged as popular general tools for most types of business:
- The Cool Farm Tool
- Farm Carbon Calculator
- Agrecalc
- Trinity AgTech’s Sandy
All are consistently improved as new science and information emerges, with most updated on a yearly basis.
Deciding which to use will to some extent be dictated by your aims – whether it is simply to measure your carbon footprint, benchmark against others, or meet supply chain requirement.
It also depends on what type of farming you do, and whether you’re interested in potentially selling carbon credits.
In addition, there are a number of sector-specific and/or in-house calculators, such as Arla’s Climate Check (see “Transition Farmer Rachel Risdon, Devon”), Alltech’s E-CO2, Eggbase, Promar, AB Agri’s Intellync and Sustell from nutrition company Royal DSM.
These are well worth considering if you’re in those sectors or supply chains, with most including comprehensive livestock productivity metrics, for example.
Typical data required for carbon calculators
- Cropping data – crop types, yields, areas, inputs etc
- Livestock – herd or flock size, feed use, manure management
- Energy and waste – fuel and energy use, water use, plastic waste and transport
Note: Data required varies by model so might not include all of the above
Cool Farm Tool
Good for: Simplicity and product supply chains
Run by the Cool Farm Alliance (CFA), and backed by 140-plus members – including big multinationals such as Unilever, PepsiCo and Syngenta to NGOs, agronomy firms and farming businesses – Cool Farm Tool has been available since 2014.
The collaboration helps with industry alignment to transition agriculture to a more sustainable future, says Richard Profit, CFA’s chief executive. “It brings consistency, accountability and transparency.”
Once filled in by farmers, the assessment can be shared with all buyers of their crops or products, saving potentially having to fill in multiple tools.
It’s predominantly aimed at arable, beef and dairy farmers, although can be used for other livestock. Upland farming is less suited.
Data entry is simplified. “We minimise the data needed and restrict it to the different inputs the farmer has influence over,” Mr Profit says.
That means an assessment could be completed within an hour, if data is readily available.
A major difference to other tools is the output is based on a crop or product basis, rather than at a farm or enterprise level – important for supply chains.
Whole-farm modelling is available for biodiversity assessments and will be extended to greenhouse gases in the future, Mr Profit says, although it is possible to consolidate separate assessments to create a whole-farm view.
Sequestration is calculated through land-use change and changes in above-ground biomass, while it uses data on animals bought, sold and born to calculate average time on farm and weights in each category.
Livestock enteric emissions are calculated and in the near future will also include feed additives as a mitigation measure.
It is free for farmers for up to five assessments – each crop or product is a different assessment. Users often also get free access beyond that via suppliers.
Next year’s spring update will complete the switch to IPCC 2019 methodology started in this year’s update, a new soil organic carbon model, and update to nitrous oxide emissions and various updates to beef and dairy modules.
Controlled environments and improved perennial crop models are also in development.
For more details, visit coolfarmtool.org
Farm Carbon Calculator
Good for: Ease of use, live results and range of farm types
Farm Carbon Toolkit developed its online Farm Carbon Calculator from 2010 as part of its aim to help farmers understand, measure, and reduce their farm’s carbon footprint.
Data is gathered for nine sections covering similar areas to the other tools. An Excel spreadsheet can be used to help identify and record data before entry.
Typically, it takes about two hours to do the first report once data has been collated, which if the farm is well-organised might take two to three hours.
The user interface was redesigned for the last big update, but a major project to rebuild the calculator’s back end is under way for next year’s updates.
That aims to improve automatic integration with various farm software programs as well as allowing uploading of Excel files to make data entry easier.
Output is on a whole farm or enterprise basis. It’s possible to have results on a product basis but needs to be a separate report from the start.
The report shows in various levels of detail the farm’s carbon emissions, sequestration and balance, explains Jonathan Smith, who co-developed the calculator.
“Benchmarking is currently against other users in your enterprise type, but we’re working on version two to analyse the data and present it in a better way.”
The last update introduced a nitrogen module, with the help of WWF, and updated livestock emissions with the latest IPCC methodology.
The intention is to show both global warming potential (GWP) and GWP* for methane in the future, Mr Smith says.
Soil carbon sequestration calculations have been improved, based on results from two years’ soil analysis using a recommended sampling method.
Livestock numbers are calculated on an average over a 12-month period, using start and end numbers and how many bought and sold during the year.
The calculator is free for farmers. A paid-for consultancy service is available to help businesses take the next steps including creating a carbon action plan.
For more details, visit calculator.farmcarbontoolkit.org.uk
Agrecalc
Good for: Mixed and livestock farms, and benchmarking
Initially developed as a research tool by SRUC and SAC Consulting, Agricultural Resource Efficiency Calculator (Agrecalc) is free for individual farmers, offering one farm profile and report a year, and access to general industry benchmarks.
For £85/year this can be upgraded to allow multiple reports, including what-if scenario planning and access to detailed benchmarks. Multiple farm profiles and group benchmarking costs £105/year.
“That kind of comparative data is important to understand what your results mean,” says Agrecalc’s agricultural systems modeller, Kaia Waxenberg.
Agrecalc footprints the whole farm before using the data to also provide enterprise- and product-specific reports.
“The allocation of emissions across the whole farm is something that is quite specific to Agrecalc.
“For example, if you grow silage that you feed to cattle on the farm, Agrecalc, unlike other tools, automatically allocates that to the cattle enterprise.”
Farmers input data into three main sections – land and crops, livestock, and energy and waste. User guidance and downloadable PDFs help with requirements.
First time use usually takes about two-and-a-half hours, with future entries roughly an hour, says Miss Waxenberg.
The greater overall detail, such as inclusion of livestock performance and efficiency metrics and detailed feed emissions, arguably gives a more meaningful result.
Soil carbon sequestration is measured for all grass and arable crop land to Intergovernmental Panel on Climate Change (IPCC) Tier 1 standards, with another module for hedgerows.
Improvements to nitrous oxide emissions calculations from fertiliser and manure use were released in October to make them more specific to UK climate and soils.
A new platform is due to be released this winter, which will improve the user experience, with future iterations likely to include automatic data pulling from third-party sources, such as BCMS and crop recording platforms.
Other improvements include emissions from additional specialised feeds and additional crop enterprises, although UK commonly grown crops are in the current version.
For more details, visit agrecalc.com
Sandy
Good for: Detailed calculations, automatic link to carbon trading scheme
Unlike other models, Trinity AgTech’s Sandy does not have a free version, costing £588/year for one farm less than 1,000ha, rising to £1,500/year for farms of more than 1,000ha.
Set-up is through a five-step process starting with an API that links with Gatekeeper and Muddy Boots to bring in rotational cropping and operation data, which is automatically kept up to date.
Similar links to livestock platforms are planned. Data can also be added directly or via Excel templates, says Oliver Rubinstein, customer success manager for Trinity AgTech.
Basic field information is required, and a digital field map can be created using field boundary data imported directly from the Rural Payments Agency if in England, or by uploading from other systems.
Historical climate data is assigned by the field’s location.
Carbon sequestration is calculated by a blended model using soil test analysis and modelling to Tier 2 IPCC 2019 standards, as are all its calculations.
Livestock farmers add data around grassland sward species, management, fuel use, as well as milk production, herd dynamics, and comprehensive livestock productivity metrics and feed rations.
There are specific models for both upland peats and organic systems.
Outputs can be on a field, enterprise or farm level, with net carbon balances shown alongside farm emissions and sequestration. Permanent grassland is treated separately to livestock.
Drill down into enterprise and more information is presented, such as emissions intensity, source and breakdown by greenhouse gas. Methane emissions are presented by both GWP and GWP*.
Currently arable-focused, a nice feature is the ability to model the impact of changes in farm practice, such as switching to zero-till or adding an agroforestry scheme.
It can also create up to six management plans based on criteria entered, such as reaching net zero without any impact on production, Mr Rubinstein explains.
“We’re trying to help farmers make use of this information.”
It also links directly into Trinity’s Natural Capital Markets carbon trading scheme, making it easy to understand the potential value currently and of management changes.
For more details, visit trinityagtech.com
Do different calculators give different results?
Twenty model farms representing every key type of UK farming are being used to find the extent to which common carbon calculators diverge in their estimates of carbon footprints in a Defra-funded project costing nearly £100,000.
The project, which is being carried out by Adas and due to be completed by next June, will compare Farm Carbon Calculator, Agrecalc, Sandy, Solagro and Cool Farm Tool, as well as a few sector-specific calculators.
“The model farms have been created to push the calculators as much as possible,” explains Adas’s Toby Townsend.
“Some include newer technologies or less common enterprises, and range from simple rotations to more complex mixed farming systems.”
A key objective is to identify and understand the importance of the reasons behind different results, particularly for emissions sources such as enteric methane, manure storage and management, soil nutrient management and land use change.
“The next steps will help target development of improved methods to boost consistency across tools, assisting users in selecting the most suitable.”
Comparison of four carbon calculators |
||||
|
|
Farm Carbon Calculator |
Cool Farm Tool |
Agrecalc |
Sandy |
|
Number of users |
7,000 |
>25,000 |
Many 1,000s |
300 |
|
Launched |
2010 |
2014 |
2012 |
2022 |
|
Assessment type |
Whole farm, and kg/output |
Product only (greenhouse gas) |
Whole farm, enterprise and product |
Whole farm, enterprise and field level |
|
Carbon sequestration |
Soil, woodland, hedgerows, perennials |
Land use and biomass change only. Soils in spring 2023 |
Soil, woodland and hedgerows |
Soil (including permanent grassland), woodland and hedgerows |
|
Livestock performance metrics (eg mortality and fertility data) |
No |
No |
Yes |
Yes |
|
Next major update |
Summer 2023 |
Spring 2023 |
Early 2023 |
Monthly updates |
|
Benchmarking |
Yes, versus other users of similar enterprise. More detailed benchmarking in development |
Spring 2024 |
Yes (more detailed in paid version) |
Yes – gives assessment of farm versus own best and worst performance |
|
Bolt-on assessments? |
No |
Biodiversity, food loss and waste and water |
No |
Biodiversity, water protection |
|
Cost |
Free to farmers |
Free for individual farmers |
Free to farmers £85-£105/year brings extra functionality |
From £588/year |
Transition Farmer Rachel Risdon, Devon
Rachel Risdon was asked by her milk buyer, Arla, to complete its Climate Check tool for her 300-cow, grass-fed dairy business.
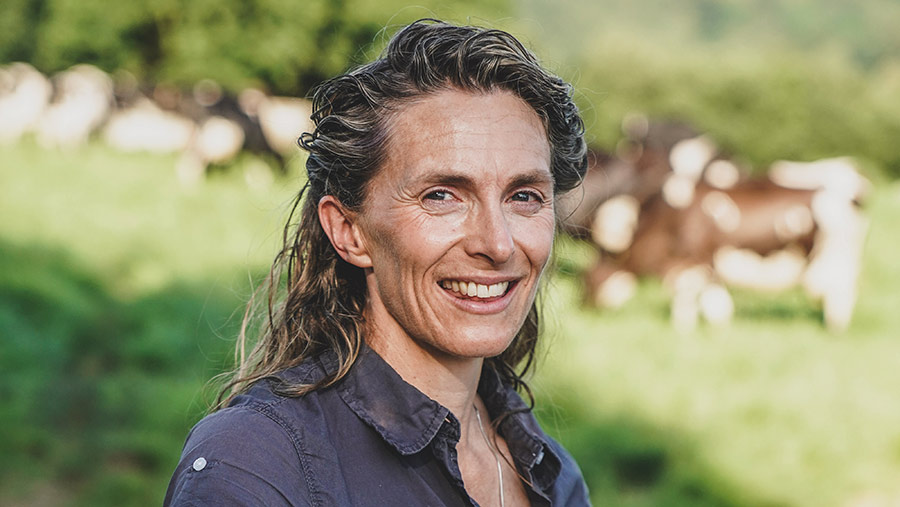
© Emily Fleur
Arla is among a number of businesses to develop or use sector-specific, in-house emissions calculators for their supply chains.
Data is gathered through 203 questions, answered online, with the preliminary carbon footprint validated by an external agricultural climate adviser.
Most of the questionnaire was reasonably straightforward, such as completing animal numbers and land use, says Mrs Risdon.
“The more complicated bits were working out fuel use, especially as we primarily use a contractor. The fuel price rises did mean the contractor knew exactly how many litres of fuel he had used an hour doing each job.”
In total, it took about three to four hours to complete, although if the contractors hadn’t known the relevant information that would have added at least another hour, she says.
Unfortunately, with the Arla dairy contract also including the farms of her two brothers-in-law, Arla has insisted on the Climate Check being combined with their businesses.
“That will make the results slightly meaningless,” she says.
Explore more / Transition
During the series we follow our group of 16 Transition Farmers through the challenges and opportunities as they seek to improve their farm businesses.
Transition is an independent editorial initiative supported by our UK-wide network of partners, who have made it possible to bring you this series.
Visit the Transition content hub to find out more.