
How UK milk producers score on efficiency but lose on profit
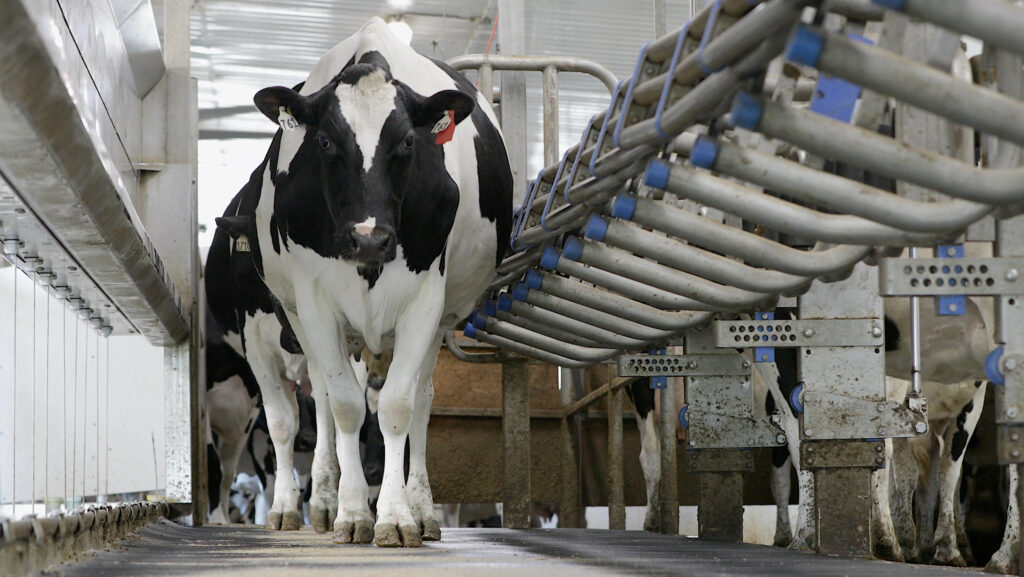
At £27/hour, Danish herds have the highest labour cost among EDF countries © Adobe Stock
The European Dairy Farmers is a hub for farm economics and comparative costings, with more than 450 farmer members across 18 countries.
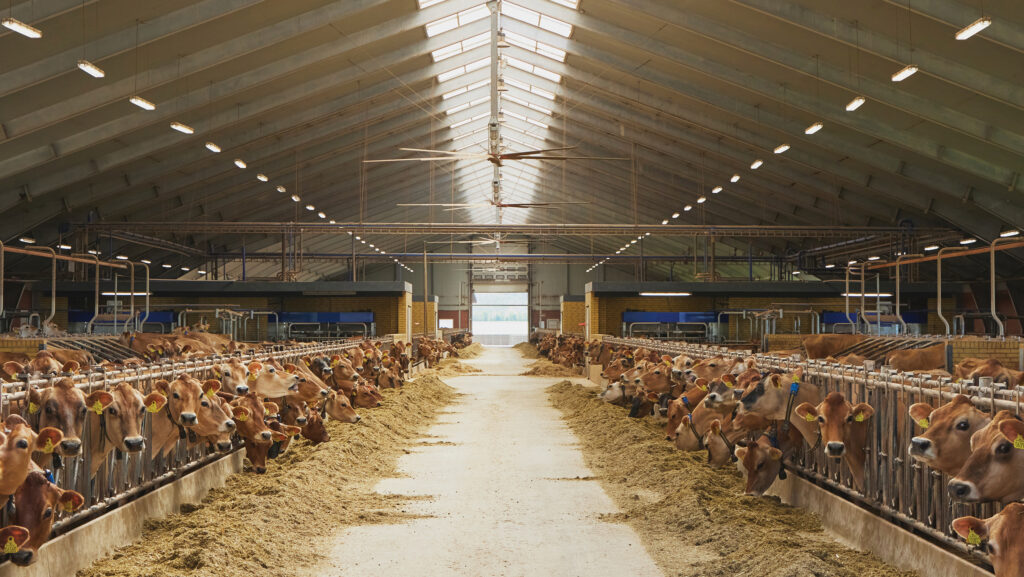
The UK group includes a wide range of milk production systems, from grass-based lower input to housed high output herds, with an average herd size of 301 cows.
This is close to the European Dairy Farmers (EDF) average of 320 cows, but considerably higher than the UK average herd size of 174 cows.
See also: Report reveals growing performance gap within dairy systems
Production is costed annually for all countries in the EDF.
The latest report, for 2023-24, reveals that a lower milk price and declining support payments result in considerably lower profits for UK members than those of equivalent dairy farms across Europe.
The bulk of the UK EDF members are in England.
© Adobe Stock
Kingshay development director Richard Simpson is the UK’s EDF scientific partner, a role in which he validates the data of individual UK farmers for the costings.
Overall, the average UK milk yield – at 9,859kg energy corrected milk (ECM) a cow – was below the EDF average of 10,682kg ECM a cow.
Within the UK figures are low-input herds producing 5,000kg a cow to high-output units with a yield above 13,600kg a cow.
They range from 100-cow herds to those with 750 cows, and an average 76% of the dairy land is in grass. For every 10 cows, there are 6.3 replacement animals in the pipeline.
The cost of production results from 2023-24 highlighted some key points, says Richard.
- UK farms are efficient – total milk production costs/kg, at 42.8p/kg, are 3.4p/kg or 7% lower that the EDF average
- Leaner machinery and lower labour costs contribute to these lower average production costs for the UK
- The average UK milk price was 3p/kg less that the EDF average, at 38.4p/kg
- Subsidy support for UK producers of 1.2p/kg was 70% below the EDF average
- UK milk profit of 2.2p/kg was 55% lower than the EDF average of 4.8p/kg.
While there have been changes in all countries since 2023-24, the withdrawal of Basic Payment Scheme in England means that the relative position of its milk producers is likely to have worsened.
“When today’s milk price is applied – which for many is close to 30p/litre – alongside ever-increasing costs, the results don’t look very rosy,” says Richard.
He points out that farmers participating in EDF are efficient business managers, performing at above average levels, who want to know how they compare to others.
They take the time and effort to put in the level of detail required to produce the reports and make the comparisons.
Different approach, different countries
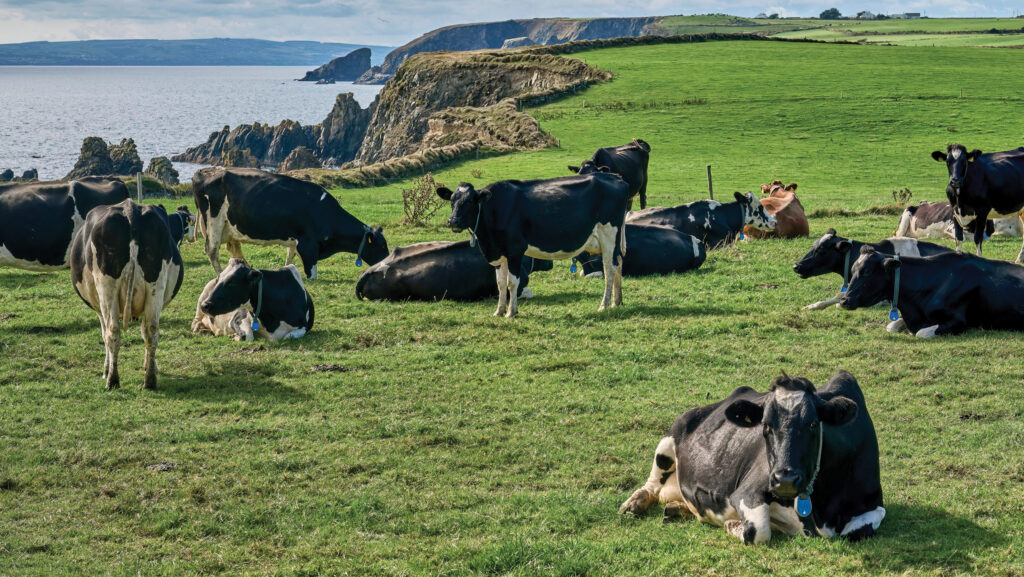
Dairy farms in the Republic of Ireland are among the most profitable © Adobe Stock
Factors that benefit continental milk producers are likely to include the wider extent of farmer co-operative ownership of processing capacity, says Richard.
“Along with this is a question of how milk is valued – in the UK, we are unique among EDF partners in having 50% of milk going for liquid use.
“Elsewhere, a higher proportion goes into cheese in particular, and other dairy products.
“Fresh produce in some countries – like France and Italy – is valued more highly and takes more space at retail level than is the case in the UK, where so much dairy goes into lower level products and branded, ultra-processed food.
“There is a massive cultural difference in the food culture of other countries and more drive to add value to milk for home sale. Although there are some good operators here on that front, and exports are important too of course.”
Value of EDF cost of production comparison
The EDF cost of production comparison is considered by many to be the “Rolls-Royce” of comparison models, says Richard.
It considers the full economic costs of milk production, going further than simple cash costs.
For example, it includes:
- An imputed cost for unpaid family labour, costed at £19/hour for an average 55-hour week for the UK herds (excluding the value of accommodation)
- A rental equivalent for farm-owned land
- Capital invested in the dairy enterprise, both owned and financed, including interest.
As well as cost of production, other metrics derived from the data include the breakeven point, entrepreneur’s profit, and other operational figures for each farm’s dairy enterprise.
There are also useful physical metrics reported and compared, says Richard.
“These include labour use reported in both hours a cow and kg of milk/hour worked.
“Others include percentage barn capacity, the land productivity reported as kg milk produced a hectare, and capital productivity reported as kg milk/£1,000 assets invested, excluding land.”
On labour costs, there is a big range within the average EDF labour rate of £18.5/hour, from £8 in Portugal to almost £27 in Denmark.
“This opens up a whole different topic, which in Denmark links with the very high level of capital investment,” says Richard.
UK dairy land rents average £357/ha, well below the EDF average of £434/ha.
EDF annual congress comes to UK
EDF farmer members gather once a year in a different country for their annual congress, which this year is being held in Chester from 23-25 June. Presentations include the cost of production figures in great detail. There will also be workshops and seven farm visits. Details and tickets are available at on the EDF website.
UK farms compared with EDF average in 2023-24 conventional non-organic farms |
||||
|
|
EDF average p/kg milk |
UK average p/kg milk |
Difference p/kg milk |
Difference |
|
Total returns |
51 |
44.9 |
-6.1 |
-12% |
|
Milk price |
41.5 |
38.4 |
-3.0 |
-7% |
|
Cow and calf sales |
4.7 |
4.9 |
0.3 |
6% |
|
Subsidies |
4.0 |
1.2 |
-2.8 |
-70% |
|
Other returns* |
0.9 |
0.3 |
-0.5 |
-60% |
|
Total costs |
46.1 |
42.8 |
-3.4 |
-7% |
|
Profit |
4.8 |
2.2 |
-2.7 |
-55% |
|
Average labour rate (£/hour) for both paid and family labour |
18.5 |
15.7 |
-2.9 |
-15% |
|
Notes: *Other returns are likely to comprise sundry sales and receipts such as certain production related payments, forage sales and grants. Source: EDF |
||||
Benefits of costings, networking and farm visits
UK council member of EDF and farmer David Jones has attended many annual EDF events overseas.
He finds the farm visit insights and depth of analysis in the costings invaluable, as well as the chance to network with other dairy farmers.
“That includes those from the UK, who you might not meet otherwise,” he says.
David runs 280 cows, milked through robots, at Hardwick Farm near Abergavenny, in partnership with his wife and his parents.
He is also co-chairman, with Will Hosford, of the Tesco sustainable dairy producer group.
The EDF costings look at measures which are sometimes not familiar to the UK approach.
“The costings are all put in the same format across the 18 countries, which makes for easy comparison,” says David.
“There are a lot of different metrics, some of which we don’t usually use in the UK, such as labour hours a cow, and it’s interesting to look at things from a different perspective.”