
Household spending on food static since 2011
 © Caiaimage/REX Shutterstock
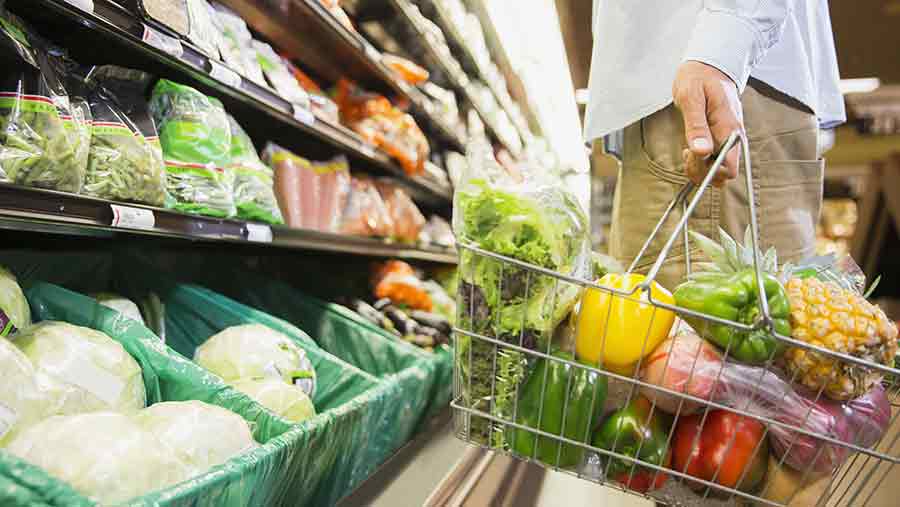
 UK household spending is increasing but the amount people spend on food has now stayed the same for four years, according to latest figures for the Office for National Statistics (OFS).
Average household spend increased nearly 3% between 2013 and 2014 from £517.30 a week (adjusted for inflation) to £531.30, with the amount spent on recreation and transport increasing.
But average household spend on food remained static at £58.80 a week, accounting for 11% of total expenditure – with no change since 2011.
The report from the OFS said this was partly due to the “increase of discount supermarket chains, increasing consumer choice and competition in the market”.
This comes at a time when farmgate prices are at their lowest for years and farm business cashflow is tight.

Food and non alcoholic drinks remained the fourth highest category for household expenditure, after transport, housing including fuel and power, and recreation an culture.
A similar amount was spent on bread, rice and cereals (£5.40 a week) and non-alcoholic drinks (£4.80 a week). Spending on fresh fruit (£3.50) and vegetables (£4.20) compares with £3.70 a week on buns, cakes and biscuits and £1.90 on chocolate.
Prior to this household average weekly expenditure had decreased between 2006 and 2012, from £547.00 to £507.40. The decline in spending started in 2007, just before the economic downturn. The UK economy showed signs of increasing momentum throughout 2013 and into 2014.