
Why you should use benchmarking data on your farm
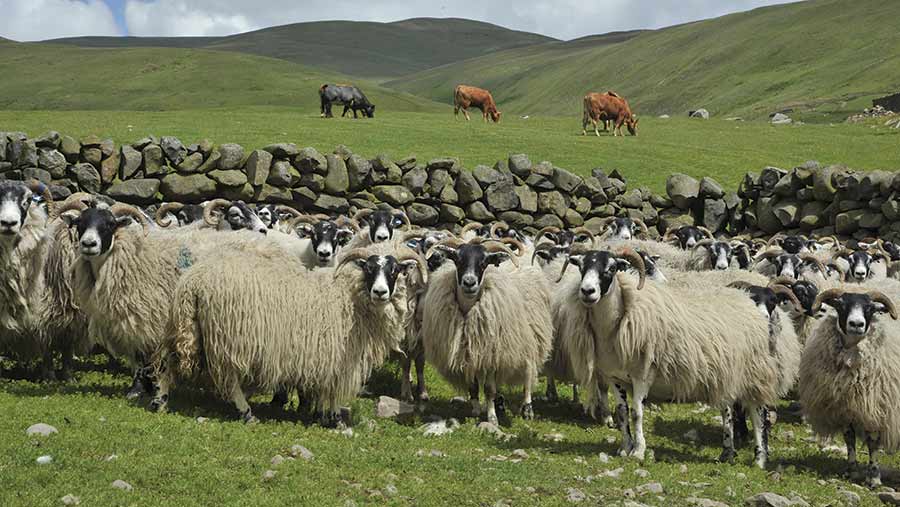 © John Eveson/FLPA/imagebroker/Rex/Shutterstock
 Farmers have been using figures to help them make decisions for millennia – only now it’s called data, and it’s becoming much more sophisticated.
Benchmarking is the comparison of the financial and technical performance of a business with others and can help identify areas for improvement and inform decision-making. This can help a business to become more efficient.
More recently, technology has made it easier to closely record and analyse data, making benchmarking easier and potentially much more sophisticated.
Anything that can be measured can be benchmarked, from yields, spray costs and contractor charges to calf weaning percentages and grass dry matter production.
As these producers and advisers prove, it doesn’t need to be complicated and sometimes several small changes can result in a big financial gain.
- ‘Group approach helps us maximise the value of DM’
- ‘Marginal gains can lead to big profitability improvement’
- ‘Benchmarking delivers confidence to move in new directions’
‘Group approach helps us maximise the value of DM’
Alex Brewster produces cattle, sheep and eggs at Rotmell Farm, Dunkeld, Perthshire
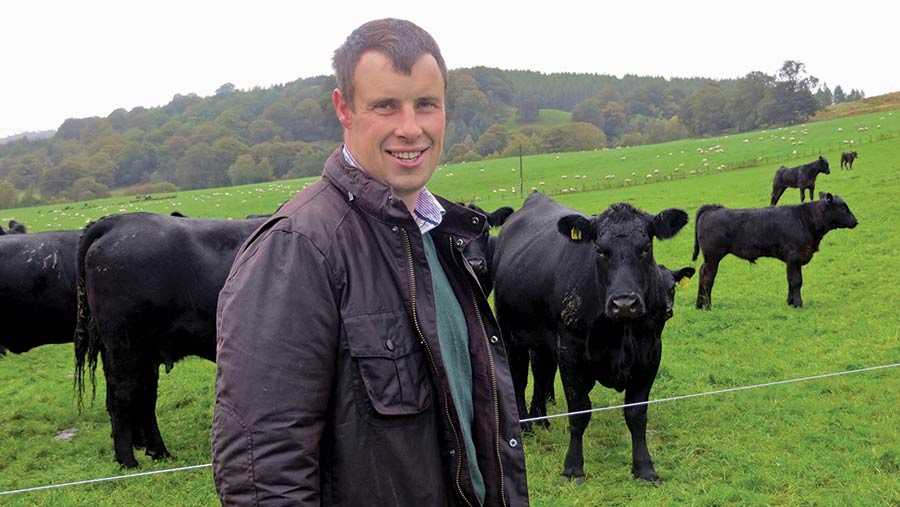
Alex Brewster
Farming in partnership with his parents Alastair and Morag, he hosts the QMS Perthshire grazing group. This meets four times a year to compare performance and to learn from each other about improving grassland management.
With the introduction of 4,000 organic free-range layers in 2006 came regular performance and cost monitoring. “It’s easier to monitor than cattle and sheep,” says Mr Brewster.
“You know your egg price, your production levels, your costs, so you know what margin you need to make a profit.”
See also: More on how precision data can improve farming businesses
His interest in improving grassland management for cattle and sheep was established before the formation of the grazing group.
However, he says that until the group began focusing on grassland management, he would have counted genetics as the most important factor in determining performance. Now he sees nutrient management as the key.
Rotmell Farm, Perthshire
992ha home farm rented from Atholl Estates
Total farmed area 3,200ha of upland and hill, with 2,200ha managed on contract or as seasonal lets on nearby units.
130 Angus suckler cows and heifers – spring and autumn calving – calves sold store and finished
800 performance recorded Blackface ewes, all lambs home-finished on forage crops or grass
4,000 free-range laying hens
“If you manage the plant well, the animal will do what it needs to do. It’s about understanding how many kg of DM you’re producing a hectare and trying to make the most of it.
“DM is worth £200/t to us and we can get up to 12t/DM/ha on some of our in-bye land.
“Two years ago I was frustrated with farming. It’s easy to blame the market, the weather or politicians for lack of margin but I couldn’t seem to get a spare moment – you have to take time off the treadmill – and that’s where the group has helped.
“Within our farm business we have always benchmarked physical farm data but performance was stalling, with only small improvements.
“I’m 90% sure we wouldn’t have made the strides we have or gained the knowledge that we have if we had been approaching this on an individual basis,” he says.
Rotational grazing systems were put in place after QMS group discussion and a family visit to New Zealand confirmed this was the right move.
Mr Brewster also invested heavily in electric fencing, importing the kit from Europe and NZ, and this has evolved into a diversification alongside the farming business.
The grazing system has come under further scrutiny through the group. Original field size averaged 8ha and these are now being split to around 2.5-3ha, says Mr Brewster.
“A semi-permanent paddock of 3ha gives the best blend for the unit of scope and scale for larger mobs of stock requiring high kg of DM and also allows silage harvest that is not overly fiddly.
Benchmarking tips
Farms can be compared with national or regional data, or more closely with similar farms to your own
It can be done anonymously through a service such as the Farm Business Survey’s online benchmarking tool, or tools like AHDB’s CropBench+
Farm consultants and accountants also often run comparisons for their clients.
Benchmarking groups have also been set up between many local farm discussion groups as well as through bodies such as AHDB and QMS
Get access to a reliable source of data from a sizeable database to benchmark yourself against and be careful of “cherry picked” and commercially-biased data
You will only get out what you put in, so be open and honest about your business performance
It’s easy to find an excuse for poor performance but benchmarking can help you move beyond that
“More precise grazing can be achieved by splitting these 3ha paddocks with temporary kit down to 0.75 or 1ha, depending on need.”
The change in grazing systems reset physical targets, and lamb weaning weight is up by 15% at 90 days. A 20% improvement in cattle performance has also been achieved.
Under set stocking and before the pastures were subdivided, cattle were achieving an average daily liveweight gain of 1.2kg, whereas they are now averaging 1.5kg/day.
“The group’s mantra is ‘more kg of lwt sold per ha, through better utilisation of grass’,” says Mr Brewster. “You’re not going to achieve that in one year, but the process gets put in place and through added efficiency you will become able to carry more livestock units/ha, hence more kgs sold.”
The use of paddocks has also improved stockmanship and made it easier – as a new one is opened, the stock head straight for it. “You see them all moving, it’s easier to spot a problem than with a traditional approach to shepherding,” says Mr Brewster.
“If your average pasture quality is 11ME, sheep will selectively graze in the first 24 hours to an ME of 12.5, giving them a higher feed base. You put cattle in behind them and the two different grazing styles make the best use of the pasture.”
A move to all spring calving from the current 40% autumn, 60% spring split is also likely so that less conserved forage has to be used over the winter – again this has resulted from the group approach and realising the value of DM production. The prime motivation for this is to reduce compaction on the forage ground.
“I’m very honest with the group, I try and give as much financial information as possible – the more you give, the more you get back.
“It’s a very open group and creates a forum for people to speak. Most of the members are relatively young and there’s a good gender mix.
“It also gives a feeling of security and people feel less isolated in their endeavour to change. We have had excellent external speakers from outside the usual conference round.”
‘Marginal gains can lead to big profitability improvement’
Emily Grant co-ordinates the QMS grazing groups

©John Eveson/FLPA/imagebroker/Rex/Shutterstock
“It can be challenging for farmers to sit down and go through their data,” says Emily Grant. However the group approach helps.
“The first stage is inward looking, assessing how their own business is performing. The second stage looks outward, seeking best practice or good ideas from others, or opportunities to become more efficient and resilient.
“However, it’s not necessarily about large-scale changes. Sometimes marginal gains across the business can have a big impact on profitability and performance.
“For example, moving your lambing date a week or two later to fit grass growth can cut purchased feed costs and provide ewes with the best quality grass to drive lactation and lamb growth rate to weaning.”
|
Costs comparison – QMS sheep grazing groups |
||
|
Costs/lw kg produced |
£/kg lw produced – Perthshire higher performer |
£/kg lw produced – Average |
|
Purchased feed |
0.13 |
0.20 |
|
Purchased fertiliser (including lime) |
0.10 |
0.09 |
|
Purchased forage |
0.02 |
0.01 |
|
Purchased minerals |
0.00 |
0.01 |
|
Vet & med |
0.17 |
0.17 |
|
Seed & sprays |
0.05 |
0.03 |
|
Contractor charges (excluding silage) |
0.03 |
0.05 |
|
Contractor charges (silage) |
0.04 |
0.02 |
|
Grazing rents |
0.02 |
0.06 |
|
Miscellaneous variable costs |
0.00 |
0.12 |
|
Purchased livestock |
0.03 |
0.24 |
|
Total variable costs |
0.59 |
0.99 |
|
Power & machinery costs |
0.39 |
0.26 |
|
Labour |
0.02 |
0.09 |
|
Administration/miscellaneous fixed costs |
0.11 |
0.19 |
|
Property costs |
0.04 |
0.14 |
|
Rent |
0.00 |
0.13 |
|
Finance |
0.08 |
0.05 |
|
Total fixed costs |
0.64 |
0.86 |
|
Total costs |
1.23 |
1.85 |
|
Source: QMS Perthshire sheep grazing group (higher performing group member compared with the average across QMS sheep groups) |
||
Despite the groups being a real mix of farm types, there is always something people can take away from a meeting.
“The exercise helps focus on what group members can change. “Using key performance indicators [performance measures or targets] has been hugely valuable because members are starting to see the financial impact from what may look like a relatively small difference in measures such as the birth to weaning rate for calves,” she says.
QMS grazing groups
Six groups in Scotland, set up two years ago, almost 100 members
Each meets four times a year to learn about making better use of grass, compare data and discuss host farm actions
Groups cover many aspects of grassland management – costs of production are one part of this
Costings were initially done through a simple spreadsheet which QMS set up for the group members to complete individually to record costs of production
Started by working out kgs of liveweight produced/ha (accounting for opening and closing stock weights)
Group members individually entered variable and fixed costs from accounts and divided this by the total kgs produced.
Further performance benchmarks added – for example scanning rates and rearing percentages
This has allowed targets to be set for host farms, eg reduce feed costs by 30% or cattle fixed costs by 36p/kg/lw
As with cost of production information, this leads to discussion – for example is it down to ease of calving and therefore breed?
“Although our top two weaning percentage members have native-bred cattle, so do the bottom two, with a pretty even mix of continental-crosses and natives in between.
“So, it’s about understanding the management behind those with good performance, and learning from them.
Costs and efficiencies
“Some of those with good KPI figures don’t necessarily have the lowest production cost. It’s all about piecing together all of the information, and understanding where costs and efficiencies can be targeted,
“So, for example, is that 1.39kg DLWG coming at a cost of buying in creep feed?”
The group has also looked at why some farms produce more kg of lwt/ha. But using these figures to compare farms needs a health warning, says Ms Grant.
“For example, a cattle finishing enterprise will have a higher kg/lwt/ha than a suckler system, because all the cattle are growing. What’s important with this figure is that farms are using it as part of their measure of performance from grass.
“We know that switching from set stocking to rotational grazing can increase DM production of grass by 20%. In turn, this will allow the stocking rate/ha to be increased, helping to drive profit.”
Sensitive information
Not all group members include sensitive information such as rent and/or finance for sharing with the groups. “We don’t have a problem with this, as we won’t compare these figures within the group anyway – they are unique to each business,” says Ms Grant.
However care must be taken with the bottom line “total cost” figures as there will be some rent and finance numbers missing in the “total cost” average, she says.
“We do encourage group members to put the numbers in for their own benefit and consideration. They need to know their bottom line and because it is a per-unit cost, these values change with productivity.”
For all the groups, probably the most valuable part of the exercise is getting together and talking through the figures and what’s happening in their farm businesses, says Ms Grant.
|
QMS grazing group performance measures for cattle |
|||
|
|
Average |
Highest |
Lowest |
|
Cattle weaning % |
87% |
96% |
80% |
|
Calf average DLWG to weaning (kgs) |
1.10 |
1.39 |
0.85 |
‘Benchmarking delivers confidence to move in new directions’
Trevor Atkinson, technical director of farm management company Sentry Farming, introduced both internal and external benchmarking to the group in 1988
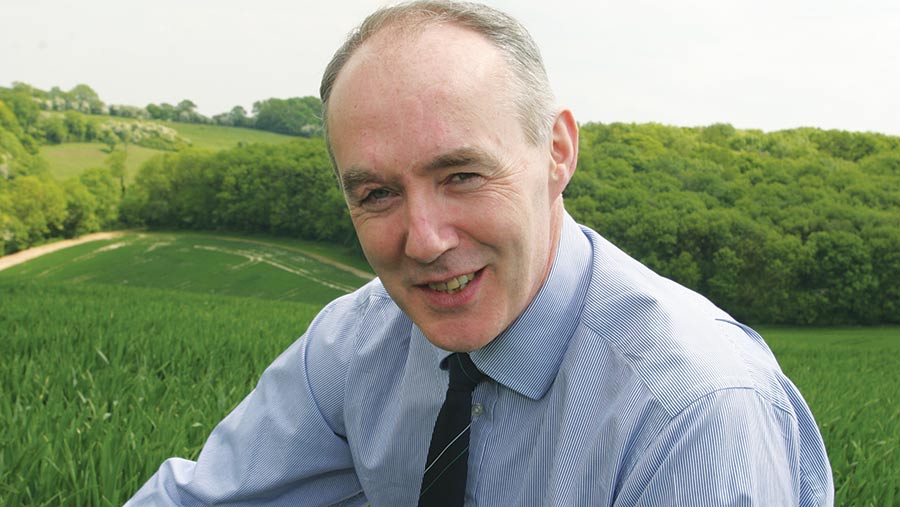
Trevor Atkinson
If you’re going to benchmark, you need to be sure that you want to be honest with yourself about your data, prepared for the challenges it will bring and willing to learn about your business, says Trevor Atkinson.
“Sentry sees benchmarking as a business learning process. With better understanding comes better decision-making.
“Somebody, somewhere will have a better idea or way of doing things.”
Sentry benchmarking
Internal database includes 77 farm agreements covering 25,000ha (equal split of FBTs, contract farming agreements and managed farms
Wide geographic area (Scotland to Kent to Dorset) and full range of soils, livestock, crops and yield potential
Further advisory work means Sentry influences decisions on about 60,000ha in total
As well as internal comparisons, wider sources of farm management information are used, for example AHDB, Scotland’s Rural College, the Farm Business Survey and general networking
Internationally, the Farm Comparison Network and International Farm Management Association are used
With a big team of managers on many farm types, there is the opportunity to discuss the good and the bad, challenge and learn from each other, he says.
“This, alongside having the confidence to try new directions, is particularly valuable in the current commodity price downturn.”
“Keeping the data interesting and with engaging messages is key. Consequently we have many different themes over the years.”
A more recent focus has been to look at rotational rather than individual crop margins to find a way to assess the benefits of some crops that do not appear in the individual crop gross margin, such as break and cover crops.
A big part of the learning process is having like-minded people discussing the data at decision-making level, says Mr Atkinson.
“Our belief in the process has been rewarded several times over by improved decision-making, leading to better bottom line performance.
“But there are no easy wins – it’s usually very incremental and bespoke to the farm. However, I would say that generally we operate with 15-20% less money invested in machinery as a result of having had this focus.
“We also see value in monitoring performance rankings over a five-year period – £/ha performance may have improved year on year, but percentile rankings may have deteriorated if others have made greater improvements.”
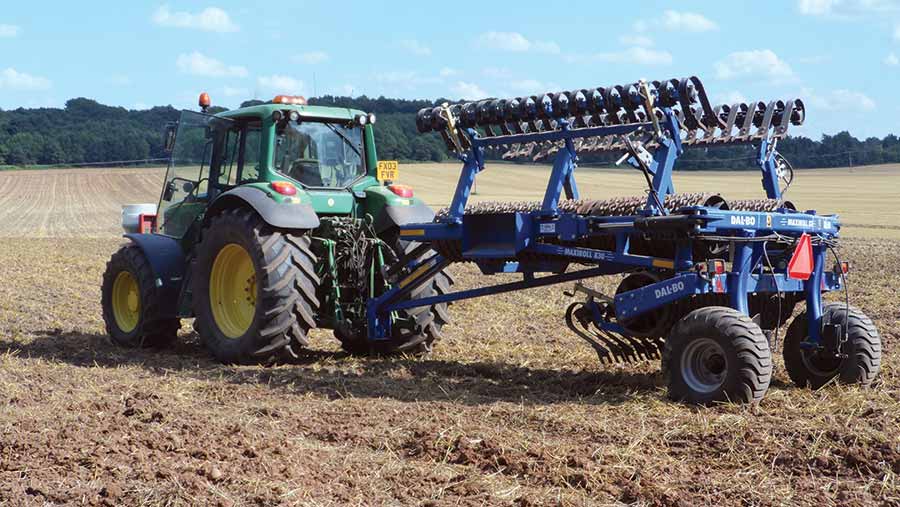
Machinery costs have been an important focus of Sentry Farming’s benchmarking
The measures have included:
- Machine hours/ha Focusing on establishment systems – in the early 1990s this figure was above 10; last year it was 4.5
- Machine passes Focusing on crop establishment costs – in the 1990s it was 5; it’s down to 3.1 on wheat this year
- Machine performance Focusing on downtime and cost/hour over the full working life – downtime this last year averaged 2.1%
- Non-farming income Focusing on complimentary income streams – this stood at £40/ha in the 1990s; in 2015 it was £120/ha
- Litres of fuel/tonne produced Fuel use per unit of production has fallen from 14 litres/t to 9.5 litres/t
- Cost of production Focusing on production margins/t rather than per ha – for wheat, this shows a range of £15/t between the top 25% and bottom 25%
- Income/£ spend Focusing on return on investment – there’s a variation of £15 in income for every £100 spent between the top 25% and bottom 25%, who in 2015 were achieving £750 worth of income (excluding BPS) for every £100 spent on labour
- Work profiles To help optimise annual workloads
- Collaboration Focusing on maximising economies of scale locally by working with neighbours on an open-book basis
- Volatility Focusing on simultaneously locking production cost to output prices – this is done by looking at the balance between the average ranking of variable costs and the average ranking of output.