
OFC report challenges farm industry to up its game
Britain is home to some world-class farmers. But the industry as a whole is lagging behind other countries, warns this year’s Oxford Farming Conference report.
UK farm efficiency has increased by just 1.4% a year since the 1960s – considerably lower than improvements abroad, it says.
The study is the seventh annual industry report commissioned by Oxford Farming Conference organisers. Written by consultant Andersons, the document outlines what gives the best British farmers the edge – and highlights why the rest of the industry must up its game.
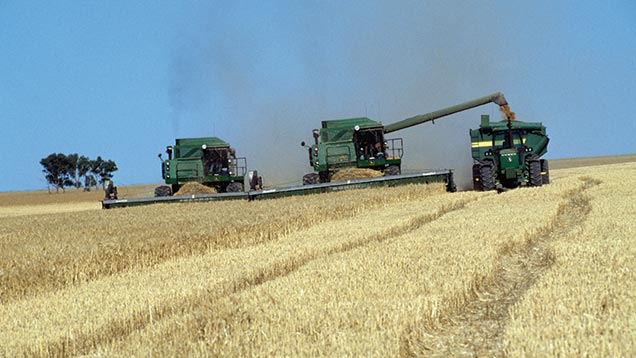
The report examines the competitiveness of four main farm types – cereals, dairy, lowland livestock and pigs. It does so by using a range of measurements, including productivity, production costs and profitability at farm level.
Despite some gains, UK agriculture has lost most competitiveness since 1991, suggests the study. Productivity is improving much faster in other countries, such as Germany, Denmark, the Netherlands, USA and New Zealand (see graph).

Performance of each country was assessed using total factor productivity (TFP) – a measure of how well the industry turns inputs into outputs. TFP ignores price changes, comparing instead the changing ratio of aggregate inputs against aggregate outputs.
Increases in TFP can be achieved by using fewer inputs to create the same outputs – or by using the same inputs to create more outputs. Although not a perfect productivity measure, it is seen as more meaningful than simply measuring tonnes a hectare or output per worker.
Net farm income per UK farmworker rose by 46% between 2005 and 2013 compared to an increase of 29% for the EU, says the report. But this 17% efficiency gain came during a period when the sterling:euro exchange rate moved in UK farmers’ favour by about 19%.
How to make farming more competitive
- Increase public and private research expenditure Increase investment in near-market research
- Improve knowledge exchange between farmers
- Focus on the top and middle sectors of the industry
- Improve access to the industry for young farmers Seek greater non-agricultural business acumen
Source: OFC report, 2015.
When it comes to input costs, the report says the UK is competitive in dairy and cereal production, but lags behind in grazing livestock production. The pig sector has higher input costs than its EU competitors, but it attracts a price premium which compensates for the greater expenditure.
Improvement
Even so, the increasingly competitive global marketplace means it would be folly for even the best farm enterprise to rest on its laurels. “Every business, no matter how successful, can always do something to improve its performance,” says report author Graham Redman.
Lower arable prices should be seen as a signal by growers to consider reviewing their yield-chasing strategy and assess the viability of low-cost systems, says the study. Alternative crops and spring cropping options could decrease costs and achieve long-term sustainability, it adds.
“Volatility is the norm in any commodity production, and always has been,” explains Mr Redman, who acknowledges that some farmers will find the report’s message hard to swallow. “Lowest cost or highest added-value producers will survive any downturns.”
Although competitive at an EU level, the report says the dairy sector has an opportunity to improve the way it uses resources – especially grazed grass and high-quality forage – by learning from producers in the world’s most competitive countries.
Similarly, the red meat sector could achieve big efficiency gains by learning from overseas producers as well as from other UK sectors – including dairy (grassland management), pigs (product differentiation), and poultry (supply chain integration and product specification).
An “enormous” range of farm performance across England means some producers are making an excellent return on capital and time invested, says the report. Others, however, are losing considerable sums of money (see table below).
Perhaps surprisingly, the main reason for this range in financial performance is cost of production rather than output. “The top performers are often marginally better at everything rather than significantly better at anything,” says Mr Redman.
Fixed costs account for 60% of the difference in profit between the best and worst cereal growers, Mr Redman suggests. As a result, growers should focus a large proportion of their time controlling expenditure on machinery, labour and land occupation.
Furthermore, some producers are oblivious to the fact they are performing badly. Management tools including benchmarking, costings books, and well-focused discussion groups could all help improve the understanding of farm costs, says the report.
“Many farmers operating in the lower quartiles might not even realise they are in that position – suggesting that the benefits of benchmarking could be tremendous on some farms,” explains Mr Redman, who says the best producers pay attention to every part of their business.
Differences
Benchmarking is already a key activity in Germany and New Zealand – two of the five countries leaving the UK trailing in their wake when it comes to farm productivity. Both these countries also show high use of costings books and other data.
Denmark, the Netherlands, the USA and New Zealand are also streets ahead when it comes to co-ordinated agricultural research and development. And all five countries have larger and more focused knowledge-exchange programmes than the UK.
Knowledge exchange in the UK is led by farm levy bodies, says the report. “Other countries, such as Denmark or New Zealand appear to have closer relationships between their farmers and their levy body or development agencies [have] greater resources with which to achieve this.”
New entrants to farming frequently adopt the most competitive business practices, suggests the report. Unlike the UK, conditions attached to inheritance tax relief encourage greater turnover of land ownership in Denmark, the Netherlands and New Zealand, where farmers are younger.
At the same time, New Zealand and the USA have less red tape than the UK – allowing farmers there more scope to make their own decisions. “Very large farms are allowed in these countries, for example, and costs are really pushed down to very low levels as a consequence.”
For UK farming to be more competitive, the study says we should all pay more attention to financial measures, not just physical performance. Growth and financial yield should be the main focus of the industry, it recommends.
“The culture seen by some of a stagnating industry, relying on support payments, needs to change to a vibrant business-oriented customer-focused competitive sector which better utilises its assets and resources,” says the document.
“This is what so much of the industry is doing, so it should be better recognised as such. Some farmers need to become more capable of using management tools such as capital appraisals, long-term business strategies and, critically, time-use plans.”
This should be supplemented with more research and development, which the report says is directly proportional to increased productivity in agriculture. “To raise productivity in the UK, we need more focused public and private research,” it adds.
“Spending a greater proportion of research funds on near-market or translational research will provide the support to apply the research to industrial requirements. This will also help attract more private funds for research too.”
A greater focus on the improved exchange of knowledge would benefit the research community while helping to get messages to those who can implement them. “It will help top performers move the productive frontier forward and those following to catch up.”
Non-farming investors should be encouraged into land ownership, says the study – not by removing tax reliefs as some suggest but by having conditions on the claimant’s eligibility including letting it to young, new entrant farmers. “This idea should be explored.”
Subsidised sectors of agriculture should look to learn more from unsupported sectors both in and out of agriculture, the report continues. And farmers should remember that the basic payment in 2019 is likely to be 25% smaller in real terms than the single payment was in 2013.
Finally, the report concludes, growers and livestock producers should recognise that despite the report identifying opportunities for improvements in UK farming, the industry has many outstanding operators that match the best in the world.
|
FARM BUSINESS INCOME |
||
|
Farm type |
Bottom 25% |
Top 25% |
|
Cereals (£/ha) |
-223 |
301 |
|
Dairy (p/litre) |
-8.7 |
5.3 |
|
Lowland livestock (£/ha) |
-145 |
316 |
|
Pigs (£s total) |
-51,425 |
122,257 |
|
Source: The Best British Farmers – what gives them the edge, Oxford Farming Conference report 2015. Figures for all farm types are for 2012-13 apart from pigs, which are for 2011-12. |
||