
How to assess cow efficiency with liveweight measurement
 © Tim Scrivener
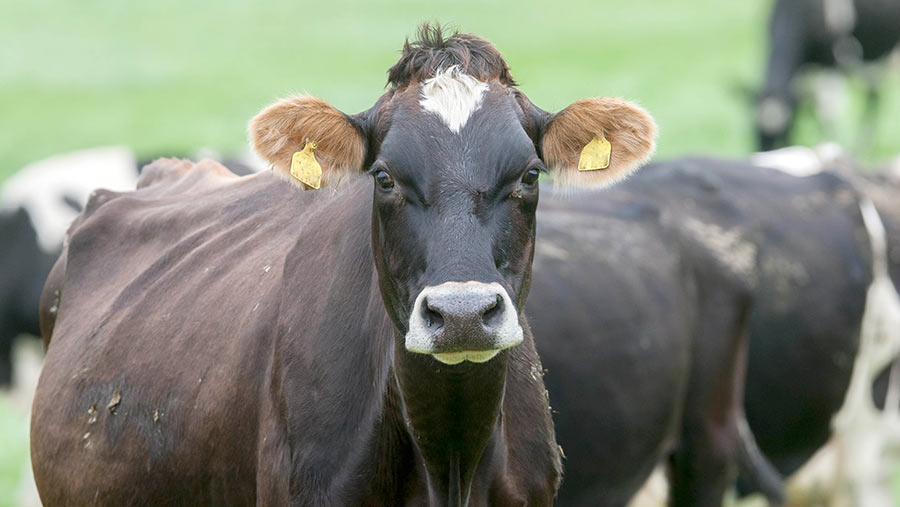
 Top producing cows make €750 (£660) more than less efficient animals, a Teagasc project has found.
County Waterford spring calver Oli O’Gorman was one of the farmers within the Deise 1250 discussion group to embark on a cow efficiency study to assess the liveweight of animals and compare it with milk solids production.
Mr O’Gorman discovered a huge variation of efficiencies within his herd. He found that the top performing mature cows were making €750 more than the less efficient animals.
See also: Factors to consider when setting dairy stocking rates
Farm facts
- 760 cows, 265 maiden heifers and 140 calves
- 215ha milking platform
- 48ha silage ground
- 74ha heifer ground
- Stocking rate of 3.5 on milking platform and 2.9 overall
The project
Mr O’Gorman, who has been steadily expanding his herd and will be milking 760 cows this season, is a member of the Deise 1250 group, a discussion group which has set a target of producing 1,250kg of milk solids per hectare.
The project began in 2016 when Brian Hilliard of Teagasc encouraged members of the discussion group to weigh all cows and collect milk recording information with all drying off data.
Cows were weighed mid-lactation in June-July, and body condition was scored at the same time.
Milking data was supplied from quarterly milk recordings.
Preliminary results revealed:
- There was a huge variation within and between herds
- Higher milk solids production per kg of liveweight (MS/kg BW) was seen in mature cows, higher EBI cows and crossbred cows
- Milk solids increased by 0.23kg for each 1kg of increase in cow liveweight
- Each €10 increase in the maintenance SI (sub-index) reduced cow liveweight by 20kg
The findings
For Mr O’Gorman’s herd, 2018 results showed that as bodyweight increased with the parity of cows, so did their milk solids production, but with a huge range at each stage.
Parity vs milk solids production |
||||
|
Parity |
BW (liveweight) (kg) |
MS/cow (kg) |
MS/kg BW (kg) |
Range of MS/kg BW (kg) |
|
1 |
407 |
321 |
0.79 |
0.44 – 1.16 |
|
2 |
480 |
416 |
0.87 |
0.60 – 1.15 |
|
3 |
522 |
442 |
0.85 |
0.48 – 1.20 |
|
4+ |
561 |
477 |
0.86 |
0.54 – 1.26 |
Among the mature (parity 4+) cows, there was a huge difference of 1.08 MS/kg BW produced by the top cows while the worst performers achieved only 0.64 MS/kg BW:
Best and worst performers |
|||||
|
|
EBI (€) |
Maint (€) |
BW kg |
MS/cow |
MS/kg BW |
|
Top 10% |
128 |
40 |
505 |
547 |
1.08 |
|
Bottom 10% |
100 |
9 |
618 |
393 |
0.64 |
Financial difference between top and bottom performers
Based on feed costs at €0.20/kg DM (18p/kg DM) and milk at €4.50/kg MS (£3.97/kg MS), the total difference in value of production between the top and bottom 10% was €750 (€693 from milk solids gained and €56 of feed cost saved).
Mr O’Gorman believes it is a very useful tool to identify if the system is carrying passenger cows, and he plans to use the data to inform his culling decisions.
“The aim going forward is for a 500kg mature cow herd with low variability producing close to 1kg MS/kg LW from as much grass as possible,’ Mr O’Gorman said.
“You can alter the whole thing if you start pumping in meal, but this is based on using as much grass as possible.”
Michael Murphy, the chairman of the conference session, commented: “We think a lot about the amount of grass we produce, but if you’re running that grass through efficient cows, you’re going to be producing a lot more milk solids than if you’re running that [grass] through inefficient cows.”
The benefits of weighing cows
- Selecting for a more efficient herd based on MS/kg cow
- Monitoring the bodyweight and performance of first lactation cows
- Establishing feeding requirements
- Developing youngstock rearing targets
- Correctly dosing medication