
A guide to soil mapping and variable-rate fertiliser
 © Jason Bye
 Routinely used in the arable sector for a number of years, soil mapping is catching on among grassland farmers as a means of better targeting nutrients and driving overall farm efficiencies.
Soil mapping essentially takes basic soil analysis to a new level by identifying variations in nutrient levels within a field through GPS mapping.
Nutrients can then be applied exactly where they are needed, either through manual adjustment at spreading or through the use of variable-rate spreading, whereby fertiliser and slurry are applied at different rates across the field.
It also provides a more detailed understanding of how successful previous nutrient management plans have been.
With continued fertiliser and feed price volatility, using fertiliser inputs in such an efficient way, to make the most of home-grown forage, is becoming increasingly relevant and will only serve to benefit livestock producers’ bottom lines.
See also: How to maximise your spring or autumn reseed
Stuart Fensom, area manager for SOYL, says farmers often believe it is not worth soil mapping a farm unless they can then apply fertiliser using variable-rate spreading – which is often not available on farm. However, he says this isn’t necessarily the case.
“Mapping of your soils is your starting point to make good crop decisions. Variable-rate is then one of a number of outcomes,” he explains.
He shared his thoughts on the benefits:
1. Understanding how well your nutrient strategy is working
The simplest use of soil maps is in better understanding how successful your past nutrient strategy has been by identifying areas on the farm that are deficient or over-supplied with specific nutrients.
For example, it might highlight areas where slurry has been oversupplied, or areas of low pH. A farmer then knows if they need to re-think their nutrient management planning.
2. Manually targeting nutrients
If only small variations in nutrient levels are identified, it may be possible to target nutrients using conventional, manual methods. This may mean simply turning the muck spreader on or off in certain areas.
It’s also possible to download a free iSOYL app from the Apple app store, which will display the nutrient map of the field on an iPad, as well as your position within that field.
This enables the spreader to be driven to areas of the field that need more nutrients and the driver can then make manual adjustments – which could simply be the decision to apply or not.
3. Using variable rate spreading
When there’s wide variation of nutrients within a field, variable-rate application of nutrients could be beneficial.
The cost of variable-rate spreading technology has now fallen to below £1,000 so it more accessible to livestock farmers. An increasing number of tractors also have built-in GPS.
If a spreader has an electronic control, it’s possible to convert it to variable-rate operation with GPS guidance. SOYL quotes a cost of £495 for this technology.
Mr Fensom stresses that targeting nutrients using soil mapping does not necessarily mean a farmer will use less nutrients overall, but it does mean that what they are using is being used more efficiently.
As soil mapping produces individual nutrient maps, using straight fertilisers can allow nutrients to be targeted more effectively, although this does create the need for a number of passes. However, Mr Fensom says it is still possible to use blended products if a farmer wishes.
How is a farm soil-mapped?
1. Fields are mapped out using GPS
A soil mapper will come out with a quad equipped with GPS and map the location of every field on the farm.
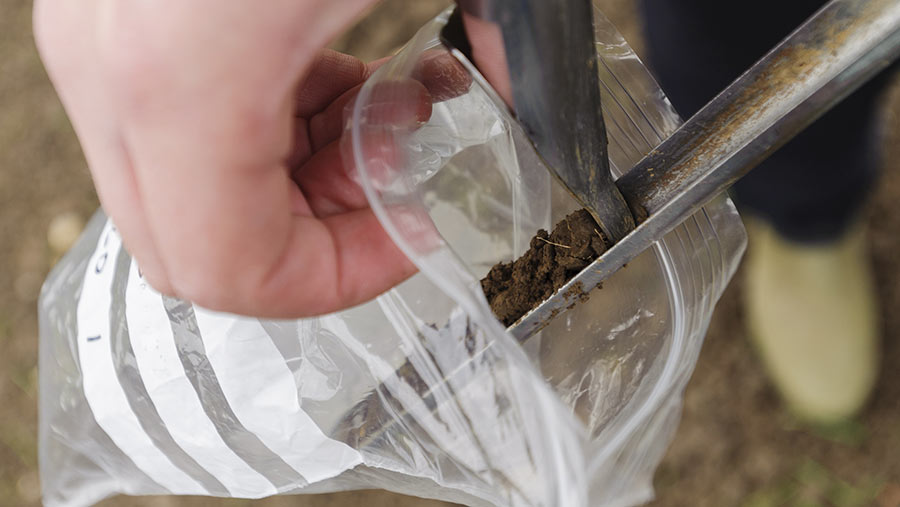
2. Soil samples are taken
The computer generates points on the map where soil samples need to be taken.
There is generally one soil sampling point per hectare, with 16 soil samples taken at each sampling point and combined in one bag.
These samples are sent away for standard P, K, Mg and pH analysis.
3. Colour coded maps are produced
Colour coded, individual field soil maps are produced using the soil analysis results.
Separate maps will be generated for P, K, Mg and pH. The colours relate to standard soil indices for these nutrients.
4. Fertiliser plans are constructed
The maps are sent to the farmer who can act on the information themselves, use recommendations provided by SOYL, or seek advice from their own FACTs qualified adviser.
More nutrients can then be targeted on the areas that need it.
Calculations will be based on available nutrients from mucks and slurries on an individual farm, with any shortfalls topped up by bagged fertiliser.
Example nutrient maps
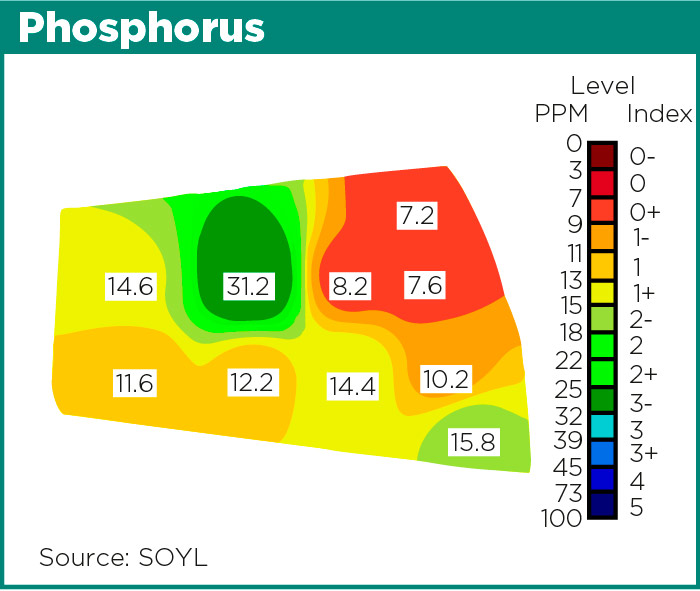
This field is deficient in phosphorus in the top right-hand corner and could benefit from higher application in this area.
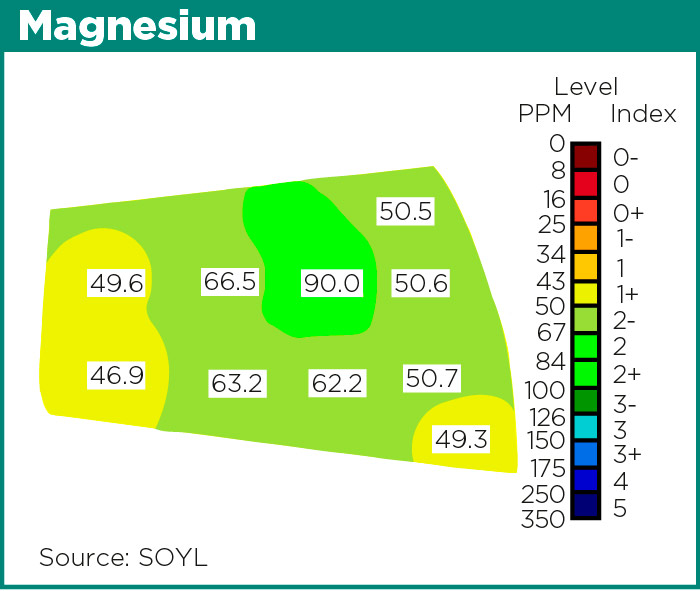
The green area in the middle of the field does not need any Mg.
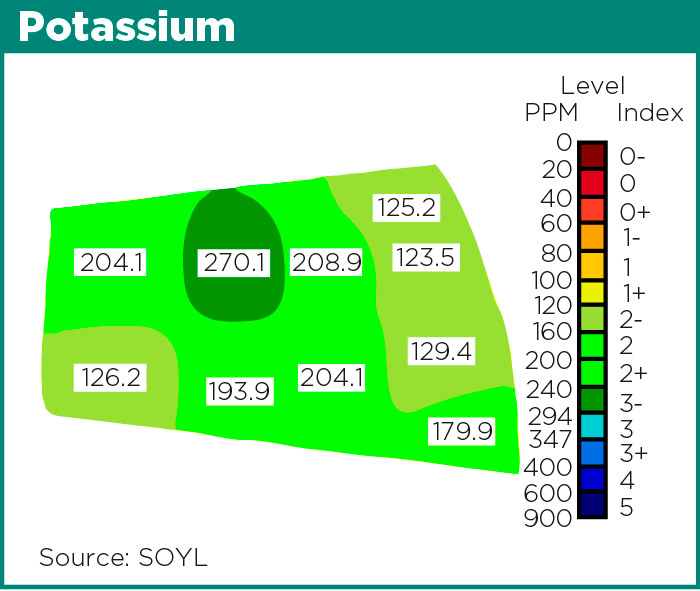
Potassium indices are good and a low rate could be applied to all of the field, except the dark green area which doesn’t require anything.
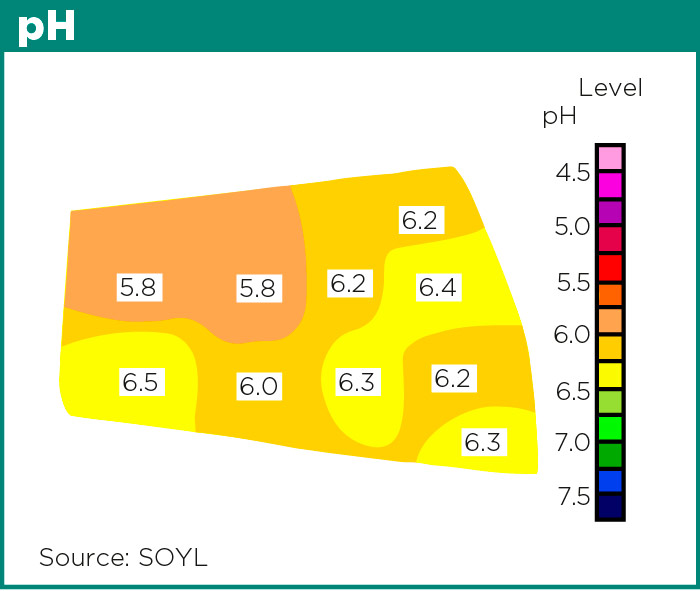
Low pH in the top left corner means this area could benefit from a higher rate of liming.
Case study: The Owen family, Potstown, Lockerbie, Dumfries & Galloway
Soil-mapping their grassland has enabled dairy farmer Gareth Owen and brother David to adopt targeted application of lime and slurry and, in their opinion, use nutrients more efficiently.
The Owens started soil mapping about four years ago to better understand the nutrient status of a new block of land they had bought.
“We felt GPS sampling would give us a better idea of what we were working with. Plus the biggest driver was the repeatability of it,” says David Owen. “It’s handy to go back to the same place and track how we’re doing.”
Since then, he has mapped all of the farm’s 142ha of grassland, which is mainly used to produce grass silage for the all-year-round housed, 250-cow herd, which yields 11,500 litres.
The plan is to resample every 4-5 years.
The farm chooses to apply straight nitrogen from the bag and uses slurry for P and K.
Mr Owen says soil mapping has helped:
1. Highlight areas low in P and K
Soil maps showed that grazing fields used for dry cows and youngstock were lower in P and K than average. Although this was not causing a problem, it could have, if left untreated. As a result, slurry has been targeted towards this ground.
2. Target lime
Lime is now targeted at low pH areas of a field prior to a reseed, whereas in the past it would have been blanket applied.
This is spread by a contractor, using a variable-rate spreader.
“We’re using the same total amount of lime, but we’re using it a lot more efficiently,” Mr Owen says.
“We’ve got a lot more of a uniform cover of grass and we’ve had good establishment.”