
Selenium-enriched fertiliser boosts Irish dairy herd’s fertility
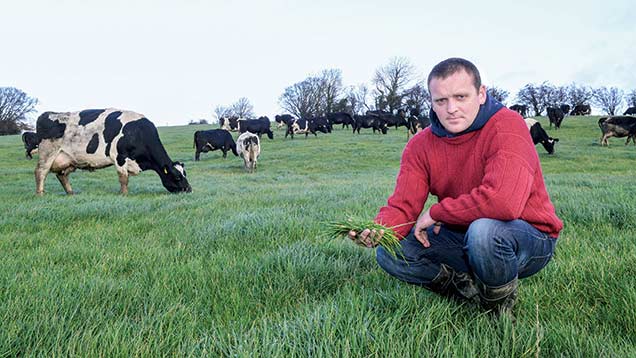 Brian Doheny
 Brian and Anne-Marie Doheny farm one of the most selenium deficient areas of Ireland, and have struggled with the effect on herd health for years.
Despite trying different boluses and adding selenium to the water, as well as giving minerals to dry cows, nothing has really worked, says Mr Doheny.
As a result the farm was having continual problems with cows retaining afterbirths, which had huge repercussions for herd fertility and vet bills.
See also: E-learning grassland management academy
In 2010, 20% of the cows at Bracken Hill Farm, Tullaroan, Kilkenny, suffered from retained cleansings, which set the calving interval back to 380 days.
“They also lost a lot of weight – the cows were just melting away in front of us,” recalls Mr Doheny. “We do have a fairly fertile herd, and just weren’t getting the results we should have.”
Having farmed in New Zealand for six years, where selenium is routinely added to grass fertiliser, Mr Doheny started looking out for a similar product in Ireland.
Last year he began a trial for Origin Fertilisers. “We started blood sampling every month and taking grass samples, and have continued that all the way through.”
Selenium levels in grass
The first samples were taken in February 2014, following a winter of adding selenium to the cows’ water at a cost of more than €10/day (£7/day).
The cows’ average blood selenium level was 1.64 micromol/litre – way below the minimum recommended level of 2-3 micromol/litre.
In March, grass samples tested at 0.04mg/kg, compared with target level of 0.2-0.3mg/kg.
Mr Doheny applied the first round of fertiliser – 25% nitrogen, 5% sulphur and 20ppm selenium – on 26 March, at a rate of 250kg/ha.
By 16 April the grass selenium content had jumped to 0.83mg/kg, while the control paddock receiving its usual amounts of urea tested at 0.04mg/kg.
“The blood results speak for themselves – they went up almost immediately to 2.33 miromol/litre,” he says.
The second application on 18 April went on at the same rate, with the trial paddock testing at 0.43mg/kg on 28 May, against 0.02mg in the control paddock.
Blood samples increased to 2.59 micromol/litre and remained above the target 2 mircomol/litre for seven of the following eight months.
This year, Mr Doheny decided to apply 38kg N/ha using a urea-based fertiliser with 42% nitrogen, 5% sulphur and 20ppm selenium on 10 February, with a second application of 52kg/ha of N on 1 April.
“I’ll top-up to 125kg/ha of N on the silage ground – as last year the second cut was much lower in selenium than the first – and continue at 38-44kg/ha of N on the grazing leys,” he says.
Grazing leys will therefore receive 500kg/ha over four or five applications, compared with 750kg/ha over two silage cuts.
The 180 Holstein cross Jersey cows calved from 5 February until 10 April, and this spring only four suffered from retained cleansings.
“Three of those had twins and the fourth had a difficult birth, so it was nothing to do with selenium deficiency,” says Mr Doheny.
Last year the calving index improved to 370 days, and he expects it to get much closer to the 365-day target this year.
“First-service conception rates improved from a three-year average of 47% to 63% in 2014, with the number of services to conception dropping from 1.9 to 1.5.”
Mr Doheny says the benefits of adding selenium far outweigh the cost. “The fertiliser works out at about £5 a cow (about 2.5p a head a day) which is a fraction of the cost of bolusing, and with zero work.
“You don’t have to do anything different with your fertiliser regime – we’ve changed absolutely nothing in the way we manage our grass and silage.
“We can now use a cheaper, off-the-shelf dry cow mineral instead of an expensive, high-spec, tailor-made mineral that didn’t really work anyway.
“I also think that the selenium in the grass is in a more available form to the cow’s system than any other supplement: I definitely wouldn’t go back,” he says.
|
Key performance indicators (KPIs) |
|||||||||
|
Year |
2011 |
2012 |
2013 |
Three-year Average |
2014 |
Difference |
Top 15% 2014 |
Top 15% Three-year average |
|
|
21-day Submission rate |
90% |
82% |
71% |
81% |
85% |
+4% |
79% |
77% |
|
|
42-day submission rate |
97% |
96% |
90% |
94% |
98% |
+4% |
93% |
91% |
|
|
First service conception rate |
55% |
46% |
39% |
47% |
63% |
+16% |
72% |
67% |
|
|
Six-week pregnancy rate |
69% |
64% |
62% |
65% |
83% |
+18% |
79% |
74% |
|
|
Overall pregnancy rate |
93% |
90% |
93% |
92% |
95.4% |
+3.4% |
|
|
|
|
Other fertility performance indicators |
|||||||||
|
Serves/conception |
1.7 |
2 |
1.9 |
1.9 |
1.5 |
-0.4 |
1.2 |
1.3 |
|
|
Percentage not in-calf |
7% |
10% |
7% |
8% |
0% |
-8% |
0% |
4% |
|
|
Short repeat intervals |
11% |
12% |
19% |
14% |
7% |
-7% |
3% |
4% |
|
|
Normal repeat intervals |
58% |
63% |
55% |
59% |
83% |
+24% |
67% |
67% |
|
|
Prolonged repeat intervals |
32% |
26% |
26% |
28% |
10% |
-18% |
17% |
20% |
|