Analysis: What makes top arable farms more profitable?
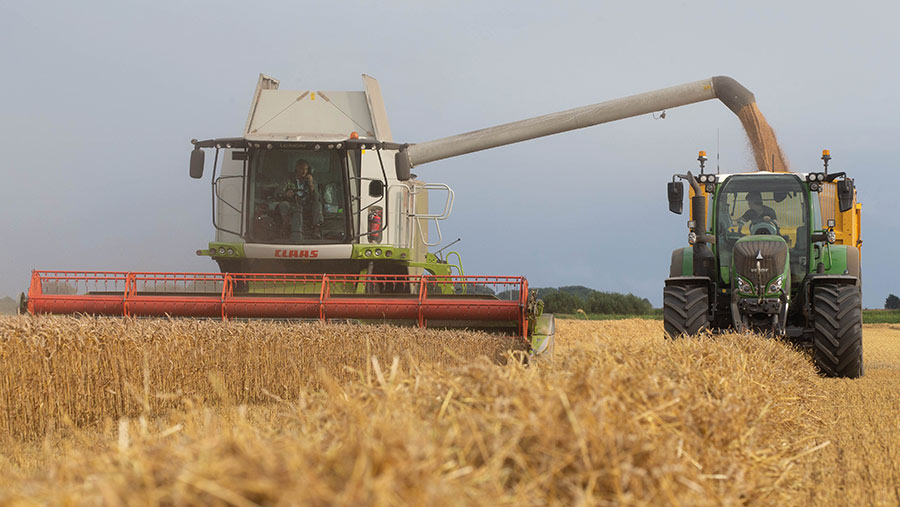 © Tim Scrivener
 AHDB data analysis has revealed the secrets behind the top 25% most profitable arable farms – and while yield is the most important factor, having a good handle on costs is also crucial.
The research has also identified eight other characteristics that mark out the top-performing growers.
See also: How a living mulch can help farmers cut their fertiliser bill
Mark Topliff, lead analyst (farm economics) has spent the past two months examining AHDB Farmbench data.
He has compared the top 25% of crop enterprises with the bottom 25% from the past three harvest years.
His aim was to identify the main factors that can deliver a profitable future for arable businesses and what growers should focus on to achieve this.
This is especially timely as farmers see their profits being squeezed with the loss of BPS payments, changes to environmental schemes, and highly volatile input and output prices.
It’s not all about income
The first finding was that it wasn’t just about maximising income. Depending on the crop and year, cost differences were sometimes bigger than the income differences, showing that both are important.
In fact, he points out that in any year, both higher income and lower costs contributed to the greater profits seen by the top performers.
Yield, not price, drives income
Taking the income side first, figures show that yield has the strongest association with income per hectare rather than crop price.
“Yields are much more likely to lead to a higher income than the prices received for the harvested crops.”
For example, with oilseed rape at the same price of £350/t, income varied massively from £500/ha to £2,000/ha, he says.
However, he adds that while this is typically the case, the equation may have changed since the analysis was carried out, with significant increases in grain and oilseed prices being more of a driver.
Labour and machinery
On the costs side, the data show that the standout influences are labour and machinery costs. Variable costs tended to be very similar.
“The top performers are using labour more efficiently, with the bottom 25% spending £70/ha more on labour and contractors,” he explains.
A higher labour cost should mean a lower contracting cost and vice versa, but this is not the case. It suggests the bottom performers are spending more than they need to on contractors and savings could be made.
Spring malting barley labour and contracting costs average 2018 to 2020 |
|||
|
|
3-year average of top 25% |
3-year average of bottom 25% |
Difference top 25% to bottom 25% |
|
Total labour2 (£/ha) |
118 |
158 |
40 |
|
Total contracting costs (£/ha)3 |
55 |
84 |
29 |
|
Total (£/ha) |
173 |
242 |
69 |
|
2 Includes paid labour and a value for the unpaid labour 3 Includes enterprise specific contracting and a share of general farm contracting charges |
|||
Expansion not the solution
One way to spread overheads is to increase the area cropped. To test this hypothesis, Mr Topliff looked at wheat area grown versus net margin.
He acknowledges that increasing the area can sometimes lead to economies of scale, but the data show this is not necessarily the case.
“At the size of most UK farms there appears to be a weak association between a larger cropped area and higher margins,” he says.
For example, at the same area of wheat (200ha), net margin ranged from £100/ha to £600-700/ha.
His advice for farmers about to expand is to ensure the farm business is operating as efficiently as possible.
That’s because if the farm is already making a loss, then it is likely that the cost of purchasing or renting of extra land will just exacerbate the current situation.
Expansion can also introduce more costs rather than spreading them. For example, it could be a parcel of land that comes up 20 miles away from the home farm and just moving kit adds fuel and labour costs.
Focusing on the new block may also take attention from the home farm, leading to a slide in performance.
“Farmers may see a block come up and feel under pressure to take it on through fear that it won’t come up again. It’s a rare opportunity.
“However, the top farmers will research it and are not afraid to turn it down if it doesn’t stack up.”
Attention to detail
Mr Topliff recalls one example of a farmer at a discussion group who had a wheat performance much higher than everybody else in the room and was asked how he did it.
“It turned out to be attention to detail. It’s about spending the time to research and challenge what they do. Then teasing out what improvements that can be done.”
So what is the conclusion from the data analysis? Mr Topliff says that while some say “yield is king”, he thinks “yield is prince”.
“It’s attention to detail that is king.”
This is illustrated by the fact that farms with the highest yields are not necessarily generating the highest net margins. Yields for the top performers ranged from 7.5t/ha to 12.5t/ha.”
Factors for top performance
© Tim Scrivener
Three years ago, AHDB looked at what characteristics make the top performing farms. There are eight:
- Minimise overheads.
- Set goals and budgets (this tends to be something that you don’t see see with the bottom 25%).
- Compare business – either with your own year-on-year, or with others and “pull up nuggets of information showing where they can perform better,” says AHDB’s Mark Topliff.
- Understand the market.
- Have a mindset for trying new things, such as carrying out on-farm trials or looking at what needs to be done and then adapting. “It may mean taking more risk.”
- Focus on details.
- Manage people well and have well-motivated staff. Staff at the top performers are encouraged to go on training courses or gain a Basis qualification, or have a say in how business tasks are done and provide ideas. “This simply may involve asking for their thoughts at coffee time on how the task can be done and they may get better suggestions.”
- Finally, specialise. This isn’t for everyone, but it can help.
New tools for better comparisons
Work is being carried out by Rothamsted Research with the aim of developing a new way for farmers to benchmark yields with similar farms.
If “yield is prince” as shown by the AHDB analysis, how can farmers identify ways to raise production?, asks Rothamsted researcher Jonathan Storkey.
One way would be to benchmark with other farmers, but this is difficult with the many environmental constraints.
“For example, are you comparing a crop on a shallow chalky soil to one on deep clay? Or has one farm seen much more spring rainfall?”
To help develop a means of better comparing yields, Rothamsted research is looking at the relationship between environment and wheat yields by analysing the Farmbench data and a new set of measurements taken as part of the Assist project.
For each location in the two datasets, there is data such as soil properties (pH and texture), P&K Indices, soil clay content (see box) and rainfall etc.
“Using this data in a model, we could have a group of farmers comparing with others with the same environmental constraints,” he says.
Armed with this tool, farmers can then see how much headroom there is for raising yields.
“If farmers are already close to the ceiling, they could end up wasting inputs such as nitrogen.”
For example, a group of farmers using FarmBench with the same environmental constraint could look at responses to nitrogen fertiliser. Any differences in response seen would be down to management rather than soil or weather.
Then they can tease out what changes they can make to improve crop responses.
AHDB’s Mark Topliff adds that discussion groups could in future be based on constraints rather than geography.
“A farmer may find the most similar farm maybe a 100 miles away rather than down the road.”
Constraint example
One example of an environmental constraint being investigated is the clay:organic matter ratio of a soil.
This is a new measure of soil health developed by Rothamsted Research, as more clay means there is more potential to store carbon.
Soils below a certain level are classed as degraded and can be improved by adding organic matter.
So researchers are looking at this ratio and whether it can explain some of the yield differences seen.
“The model may show that a higher organic matter is the reason and farmers could then raise yields,” says Rothamsted researcher Jonathan Storkey.
However, he cautions that some soils may never get to 12t/ha because of other constraints that can’t be changed, so farmers will need to manage their expectations.