How arable data analytics could counteract the loss of BPS
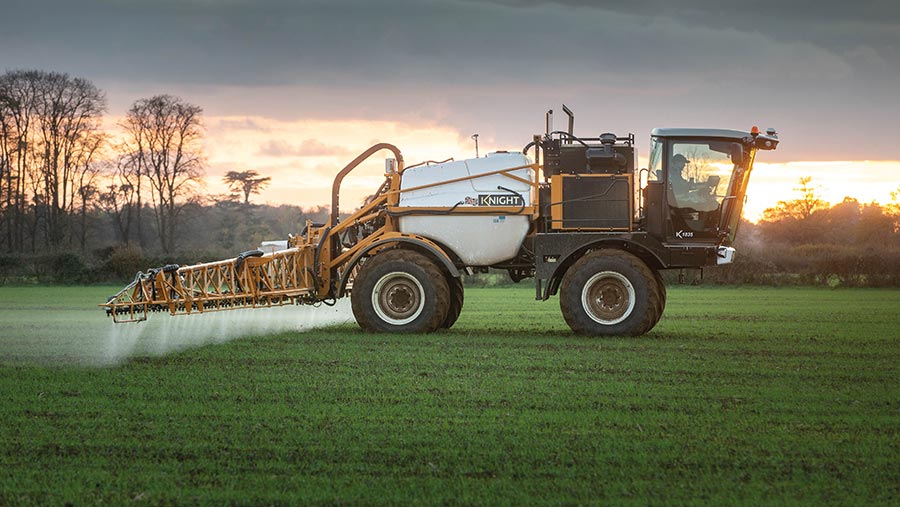 © Tim Scrivener
 Could insights from data analytics drive an improvement in business performance that will counteract the loss of Basic Payment Scheme income?
That’s the ambitious objective the 15 farmers in Yagro’s steering group have set for its Analytics products.
“From the whole system when it is live, the national steering group have said we want you to deliver £200/ha, which is BPS,” says Gareth Davies, the firm’s chief executive officer.
See also: Beet growers reveal the massive yield cost of virus yellows
“We need to build in enough functionality to look at enough parts of the farm to do that, but that’s our North Star.”
The firm’s ethos is bringing information to farmers to help them make better business decisions, he explains. Initially, that was around procurement support and an agrochemical price comparison.
“We quickly realised our customers wanted more data and analysis to help them make better decisions, not just agchem pricing.”
In late 2018, Yagro was successful in getting a grant from Innovate UK to build a commercial intelligence system to help farmers understand the detail and manage their farm business at a whole farm level.
The initial service helps growers understand their costs of production for particular crops, varieties or fields, and identify the contributing factors to that cost of production. It then compares to other farms.
Starting point
The starting point is a simple export from farm management software data, usually for five years, including preferably field-level yields, says Mr Davies.
“For farmers, there is no data entry. We have built a sophisticated ingestion engine that cleans, standardises and learns common errors in the data to automatically resolve them.
“We are obsessive about the data quality, so it makes sense when you compare it with others or on your farm.”
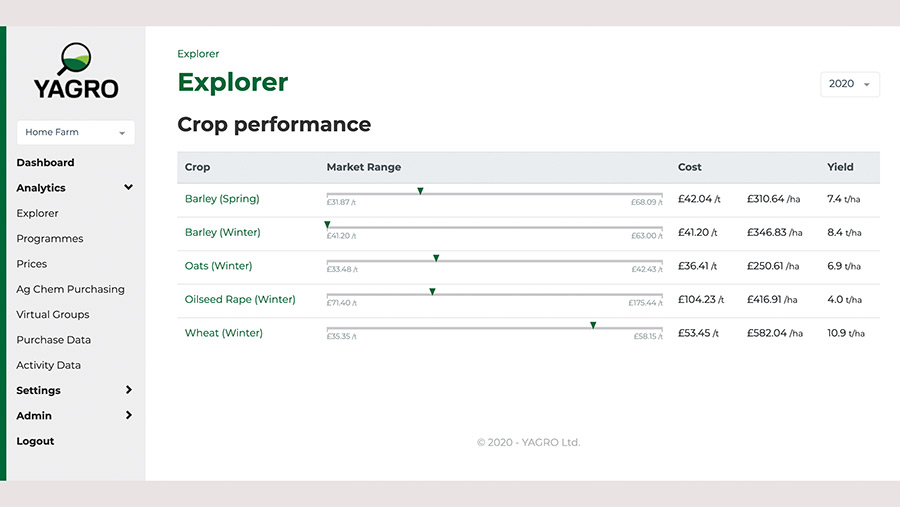
A screenshot of Yagro’s Explorer software © Yagro
The data is used to provide insights from three different views: Explorer, Programmes and Prices. “Explorer is a view of your cost of production as cost/t. We reference yield and cost/ha, but how good you are is about your cost of production.”
Currently, just variable costs are used, but crop sales will be added by the end of 2020, with fixed cost details within 12 months, he says.
Benchmarking
The farm’s average cost/t is available for each crop in each season, and how it compares with other farms signed up for the service.
It immediately helps pinpoint whether a farm is performing well against the average for a crop, or whether it has a much higher cost of production – not just for the last season, but how performance changes over time, he says.
According to Mr Davies, that is normally as far as other benchmarking systems go. “So you might end up with a picture that ‘I’m not doing well’, but no answers of what to do. But we go into a huge amount of more detail.
“For example, my cost of production is high, but which cost categories does this come from? Is there a category which is much higher than others? Where does my seed, fertiliser and chemical cost efficiency stand?”
Users can even drill down further into different types of chemistry, such as fungicides, herbicides or growth regulators.
“It allows you to dig into specific cost drivers on farm. When we release sales and fixed costs into this model, it will effectively build a full profit and loss for the business.
“That will show you whether your gross margin is being compromised by poor sales performance, or your overall contribution is being shot by really high machinery or labour costs.”
Similar analysis can be made by variety or by field, he says. “Most farmers grow more than one variety – how are they performing? Is one much cheaper to grow? Consistently each year? Why?”
“For example, it might cost more to grow the same yield of one variety compared with another – are you getting a better price for that, or are they all going into the same market? It helps farms understand if they are doing the right thing.”
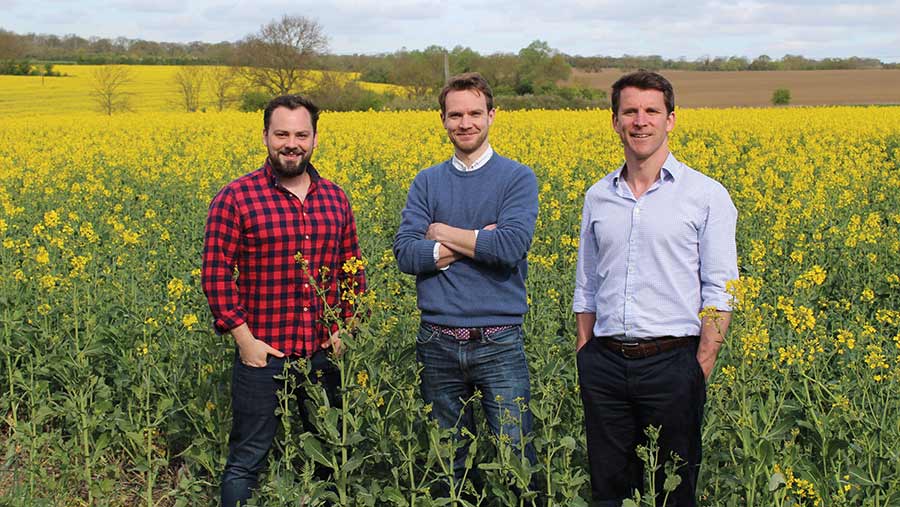
Yagro’s Gareth Davies (centre), flanked by co-founders Dan Jolly (right) and Richard Sears © Yagro
Field comparisons
“With fields, you ask different questions. With ELM [Environmental Land Management scheme] coming, is poorer performance in a field consistent year on year regardless of crop? These might be ones to consider for ELM – we hope to bring a view that compares profit performance with being in ELM, taking into account all the costs associated with the scheme.”
A further step is digging more into the reasons behind high costs of production. For example, if your fungicide programme for a particular crop or variety is high, there are three potential way of reducing costs – product choice, the rates and price, he says.
That’s where the programme and price modules come in. The programme module pulls how much active ingredient has been applied to a crop or variety, and compares it with the median rate of what others have applied in that season, and what the difference in cost is.
“It shows the opportunity by giving you a sense of the excess you’re spending compared with the market.
“Context is important – maybe you have a blackgrass problem which is why your costs are higher, but it starts showing where you might reduce that difference.”
Product buying
Differences in costs could also be due to how well you are buying products, he adds. “Price check is integrated into the service. It gives you product by product what you have spent and what is the cheapest price in the market.”
If prices are higher than the market that gives opportunity to trim costs by better negotiation next time or via rebate, he says.
The service can also suggest other identical products, which could be cheaper, he adds. It doesn’t highlight alternatives unless they are identical in active ingredients, but distributor exclusives are flagged.
“Ultimately, this is all about actionability, drilling into a level of detail with the programme views that are about marginal gains, versus should I be doing this type analysis with the top-level Explorer view.
“We care deeply that farmers use this information to do something. That can be directly on their own, in collaboration with advisers, or the other one is by talking with and sharing factual information with some peers that you trust.
Farm groups
“That’s why we’ve released a Virtual Groups module. You can invite up to five other farms into a group and share key performance indicators [KPIs].”
This starts by comparing cost/t for each crop across the different farms, impact of yields, and digs deeper into the different cost categories, such as herbicides, fungicides, fertiliser and seeds. It doesn’t go as far as the individual farm’s own platform data, he notes.
“It helps drive a conversation, and you can then also set up certain KPIs for the coming season – for example, who is going to win on fungicide spend a tonne. We’ve seen a lot of interest in this approach already.”
Data privacy and ownership is crucial. “We always put the farmer first. We’re wholly independent, and in regards to data we never share or sell any data we get from the farm, and the data always remains fully owned by the farm and they retain full rights over it. We only use data for the purposes of the service you’re signing up for,” he adds.
Launched in October about 70 farms, representing 80,000ha, are currently in the platform. He hopes it will be up to 200 by the end of the year.
“The analytics costs £2.50/ha for the module, but we are targeting initially at least £25/ha improvement in business performance as a result of using the service.”
Case study: Honingham Thorpe Farms, Norfolk
The Yagro Analytics platform has transformed the ease to which Jamie Lockhart, a Nuffield scholar and director of farming at Honingham Thorpe Farms, near Norwich, is able to analyse data recorded in Gatekeeper.
He has been very impressed with how easy it is to use, the simplicity of the layout, which really encourages him to delve deeper.
Farm facts
Jamie Lockhart © Nuffield Farming Scholarships Trust
- Five miles west of Norwich
- About 3,200ha
- Grow a range of combinable crops along with onions, potatoes, parsnips and sugar beet
“It gives you a pyramid of information from the top-level farm and crop performance. Drilling down to a field level, and combining that with soil types and other relevant aspects of how we drive yield, we can start to build quite an accurate picture of what crops suit what parts of the farm.”
He says it helps him build his budget for forecast spend, and can do that at a variety level, not just crop level. “It is giving us a far more accurate tool to both look forward and back, and see what was a good spend or return on investment.”
Malting premium
For example, it has helped Mr Lockhart analyse whether the premium for malting barley warrants the yield reduction for a particular variety versus growing it for feed. “It helps us understand the value of the premium.”
It has also helped him analyse the impact of last season’s delayed drilling. “We see that as a bad thing, but drilling later last year gave us a significant saving on herbicides and fungicides to some degree. Yes, we had a yield penalty, but our gross margin return at the end was far better than we feared.
“By being forced to drill later, we got all those advantages everyone tells us you get by having less blackgrass and less need for expensive chemical control. By being able to go back to see that as a pooled or individual result focuses the mind.”
Virtual groups
The next stage is to set up virtual groups with other similar farms. “In terms of cost//t, we’re probably middle of the road for spring barley, producing winter barley cheaper than the majority, and on our oilseed rape slightly more expensive.
“So if I could ring one of the farmers in the virtual group to help understand why they were cheaper, what they were doing differently, there might be things to learn.”