How to get more from your on-farm crop trials
By taking some practical steps to trial design, one researcher believes farmers can improve the robustness of their tramline and split field trials, leading to more informed cropping decisions.
In fact, Adas researcher Daniel Kindred eventually sees networks of farmers carrying out trials becoming a key part of UK crop research.
So rather than having the current top-down approach, this bottom-up, farm-centric approach, with farmers and researchers working together, could deliver answers to key problems.
Dr Kindred points to farmers’ growing desire to learn more, as shown by the interest in AHDB Monitor Farms, the Innovative Farmers initiative, as well as Basf’s Real Results and Adas’ Yield Enhancement Network.
See also: 4 farmers test new techniques through on-farm trials
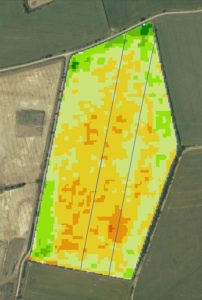
Satellite image of Ian Lutey’s 2017 trial showing variation in crop before T1 treatment
These farmers want to learn more from their data about the factors limiting yield, as well as from other farmers.
One example is Ian Lutey, who has used trials to find solutions to a blackgrass problem, as well as testing how new products perform in his crops.
Farming 1,500ha on the north-eastern edge of St Neots, Mr Lutey’s interest in trials started seven years ago, shortly after starting his current role.
He faced a resistant blackgrass problem and was looking to beef up his herbicide strategy. He hosted plot trials carried out by an agchem company and says they threw up some interesting results.
“By the second and third year of trials, you could really pick out the plots where the herbicide strategy was delivering much better control,” he says.
“One surprise was that pendimethalin, which on paper should not have added any control, was in fact working on the blackgrass in these fields.”
Limitations of on-farm trials
However, replicated plot trials are not practical for farmers and those doing their own research opt for tramline or split-field trials. But these also have their limitations.
“We found that you need a response greater than 0.5t/ha to see any difference,” says Mr Lutey.
But it is all about many incremental improvements, so farmers could be missing out on genuine yield gains, adds Dr Kindred.
Worse still, farmers could see a false benefit and spend money on a treatment that is bringing no benefit.
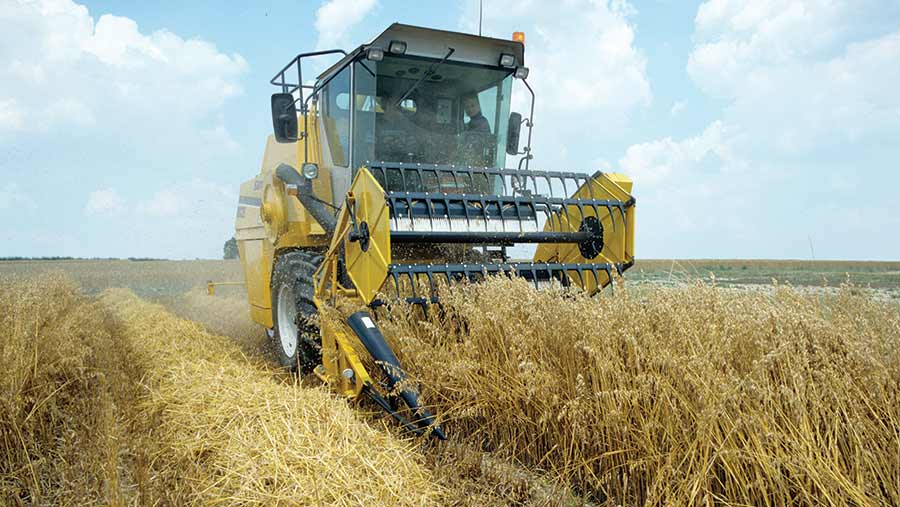
© Nigel Cattlin/Alamy Stock Photo
Natural variability
Dr Kindred explains that the problem is the large natural variability seen across fields. Farmers, therefore, need to get a handle of this variation in order to have confidence in their results.
One way is to repeat the trial over two to three seasons – an approach taken by Mr Lutey.
“In one trial, we saw a 0.5t/ha benefit in the first year, no difference in year two and a smaller benefit in the third year. In this case, the low cost of the product meant even a response once every three years still pays.”
Another tip from Dr Kindred when splitting a field is to go for three areas rather than two. Then you can have control areas with the treatment in the middle.
The two controls give you an idea of the variation, helping farmers assess whether any benefit seen is real, he explains.
Other tips include selecting the most uniform field and avoiding headlands (see “Daniel Kindred’s top tips for on-farm trials”).
Daniel Kindred’s top tips for on-farm trials
- Be clear on the question you want to answer. If your neighbours are asking the same question, do it together, as getting the same conclusions make them more trustworthy and valuable
- Choose a field that is not too variable, or one where you at least understand how it varies and can take account of this in the layout. Variation along tramlines is less of a problem than across – in fact, it can show how a treatment affects yields over different soil types
- Avoid headlands and trees
- Google Earth can help show any variation in that field
- Plots should be two or more spreader bouts when testing fertiliser applied by spinners. Wide plots are better if using satellite imagery
- Rather than splitting a field in half, do three areas, the outside two control and the middle one treated. This gives you two lines to observe any differences. The two controls should yield the same and if not, it gives some measure of the variability to help you interpret the results. If the difference between the controls is greater than the response, then you cannot read anything into the trial
- Ensure the only difference is the treatment being applied
- Keep good records of all treatments
- Mark out and measure the area precisely for harvest, especially if weighing over a weighbridge
- Calibrate your combine meter
- When using a yield monitor on a combine, have at least two header widths a treatment. For weighbridge, ensure there is a similar number of tramlines in each block, as a wheeling in the combine swath can depress yield by 0.5t/ha
- Satellite data is now widely available – consider getting data in June/July to see if there is any treatment effect on crop biomass
Note: Based on the Real Results Circle farmer trial pack pulled together by Adas and Basf
A third way
For farmers looking for more precision, Adas is developing Agronomics, an approach offering the greater accuracy of small-plot trials, but in bigger fields.
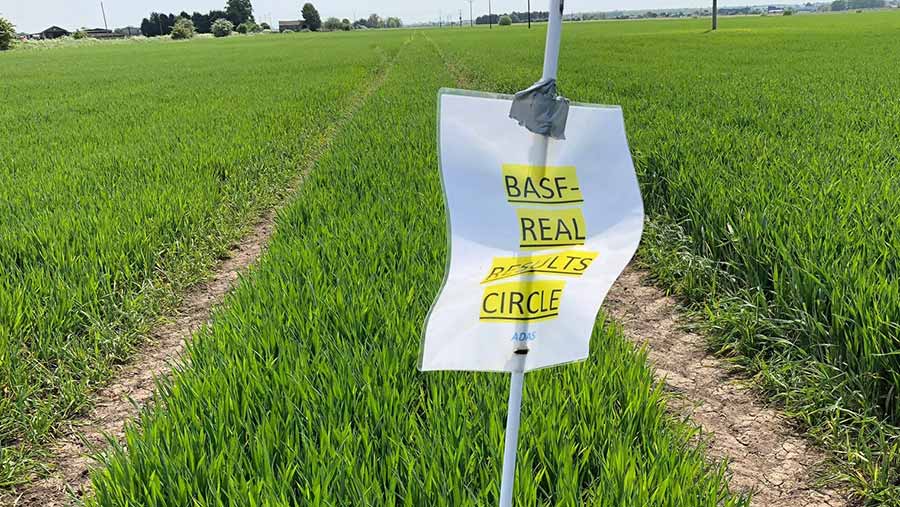
This approach is being used in the Basf Real Results Circle, where 50 farmers are carrying out comparisons of different fungicide treatments (see “Why was the Real Farm Results Circle established and what are its aims?”).
Adas is managing these tramline trials with help from Agspace, which map the trial fields to gain an understanding of variation. The plots are then laid out to minimise variation between treatments.
Farmers apply the fungicide treatments and Adas scientists then return to each farm to do disease assessments. They also take soil samples, which enables the calculation of potential yield. Crop biomass is also mapped by satellite.
Novel statistics
A key part is the novel statistical analysis, developed by Adas, that indicates the level of confidence in the result.
Andrew Smooker, Basf agronomy manager in Cambridgeshire, says in the first year of Real Results, there was a significant difference detected in 10 of the 50 sites. This was despite being a low-disease year.
In fact, in some fields they were able to go down to 0.1-0.2t/ha confidence, which is as accurate as plot trials.
This season, Mr Smooker hopes to improve sensitivity at the other sites by using more combine yield mapping data.
Dr Kindred explains that combine yield data can be more valuable than weighbridge results, as the latter does not give any indication of the variability across the plot.
The weighbridge approach also relies on an accurate measurement of the area.
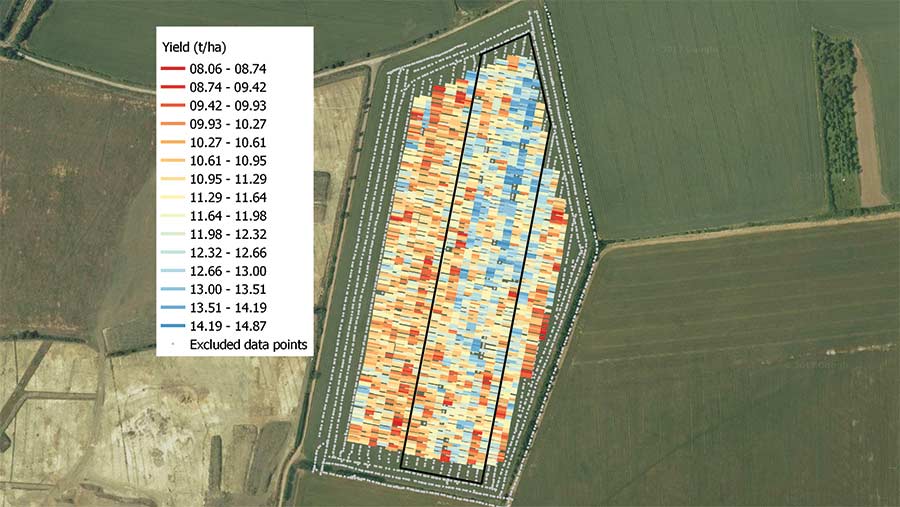
Combine yield map from Ian Lutey’s 2017 trial © Digital-Globe
Future
Looking to the future, Dr Kindred sees this network approach having real value in research, especially for soil and nutrition.
“Small-plot trials hide any soil variation, so we only learn about soils by trialling across many fields, but fields vary by much more than just soil.”
Field-scale experiments however, can test effects across soil types within fields, and can be done across many more fields. He believes this gives a whole new way to research crop nutrition and soils.
This approach could help find answers to many questions, such as what nitrogen fertiliser approach farmers need to meet milling specs or how to deal with cabbage stem flea beetle in oilseed rape.
Why was the Real Farm Results Circle established and what are its aims?
Pesticide efficacy data is based on small-plot work, but when speaking with agronomists and growers, there is a thirst to get up to field level, says Andrew Smooker.
However, data from larger-scale trials tends to be more anecdotal, so the aim of the Real Results Circle is to get a robust approach at field scale.
Another part of this initiative is to bring farmers together at an event each autumn to share this best practice.
It uses Adas’ Agronomics approach, although Daniel Kindred points out that it’s the first time it has been done at this scale, across 50 farms.
One of these farmers, Ian Lutey, wasn’t expecting to see any difference between treatments last season. However, he saw a 0.72t/ha benefit of applying an SDHI fungicide at T1, which was significant.
Leaf testing
Mr Smooker adds that leaf testing before the T2 spray in crops that were perceived to be clean found that two-thirds of leaf one and leaf two were infected.
He believes latent infection explained why Mr Lutey saw a yield benefit.
Based on this difference, Mr Lutey has changed his approach. His default is now to use two SDHIs (at T1 and T2), even in a lower-risk season, instead of an azole plus strobilurin at the T1 timing.
All farmers receive a report and have the opportunity to go along to a conference in November, where they can share their experiences and learn from each other.