Why micronutrition is essential for nitrogen use efficiency
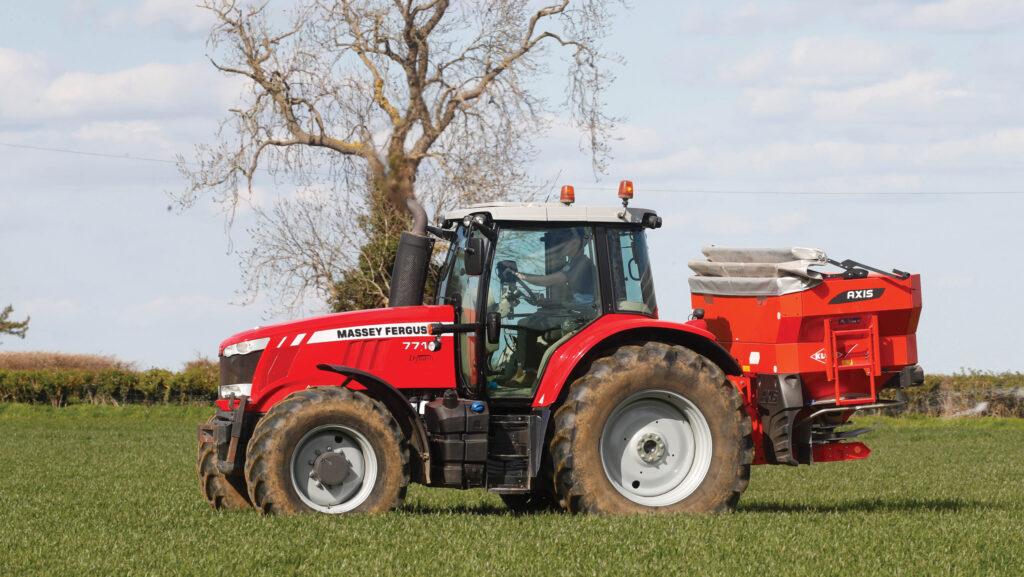 Applying nitrogen to winter wheat © Tim Scrivener
 Understanding how nitrogen is processed inside the plant highlights the crucial role of micronutrition in optimising nitrogen use.
Nitrogen assimilation is fundamental to plant development, and depending on the form of nitrogen available, must be processed along specific metabolic pathways.
“Nitrogen doesn’t just miraculously turn from nitrate into protein,” explains independent crop health expert Joel Williams.
“It involves complex reactions that require energy and micronutrients such as molybdenum, sulphur, manganese and magnesium to complete the process.”
See also: Fertiliser buying advice as Iran conflict squeezes supplies
Without balanced plant nutrition, crops cannot optimise this conversion.
It is the efficiency of these metabolic pathways that determines the efficiency of nitrogen uptake and how much biomass and yield crops can produce.
“Plants ultimately want to make functional molecules such as protein, chlorophyll and DNA, and they use nitrogen as a building block to do this,” highlights Joel.
Micronutrient limitations
Even when nitrogen is applied at appropriate rates, deficiencies in key micronutrients can reduce nitrogen use efficiency and restrict:
- Nitrate reduction
- Ammonium assimilation
- Amino acid synthesis
- Protein formation
Instead of contributing to growth, nitrogen may remain in inorganic form within plant tissues or become vulnerable to environmental loss.
“Nitrogen drives yield, but micronutrients determine how effectively nitrogen becomes yield,” says Joel.
The role of micronutrients
Unlike nitrogen, micronutrients are required in very small quantities but have disproportionately large effects on metabolic performance.
Along each step of the nitrogen assimilation pathway, different micronutrients are required to act as enzyme cofactors or metabolic enablers.
Plants absorb nitrogen primarily as nitrate, which is taken up through the roots.
Once inside the plant, nitrate is first reduced to nitrite by the nitrate reductase enzyme, which requires molybdenum, sulphur, and iron.
“Without sufficient molybdenum, sulphur and iron, nitrate accumulates in the plant because it cannot move down the metabolic pathway.
“This creates a bottleneck, leading to poor plant health and reduced feed or nutrient value,” says Joel.
- Molybdenum is structurally required for the nitrate reductase enzyme activity.
- Sulphur supports nitrate reduction via enzyme formation and N metabolism.
- Iron supports the electron transport systems required during the process.
Manganese and magnesium
Nitrite is then further reduced to ammonia by the nitrite reductase enzyme.
Once ammonia is formed, manganese and magnesium become critical.
Ammonia is the key usable form of nitrogen for plants, says Joel.
“It is incorporated into amino acids, which are the foundational compounds from which proteins and structural nitrogen compounds are built,” he says.
- Manganese activates enzymes involved in ammonium assimilation into amino acids.
- Magnesium stabilises the energy-carrying molecule ATP for these reactions and supports protein synthesis within cells.
If manganese or magnesium supply is insufficient, ammonia conversion into amino acids slows, reducing protein formation and limiting crop growth.
“In effect, nitrogen may be present in the plant, but it’s not being converted into yield-forming compounds,” says Joel.
This entire process underpins biomass production and grain protein formation.
Tissue testing key to improving nitrogen use efficiency
Nitrogen fertiliser effectiveness is fundamentally linked to plant physiology.
Ensuring adequate availability of micronutrients supports the enzymatic processes that convert nitrate into usable organic nitrogen.
As farmers and growers aim to maximise fertiliser return and reduce losses, managing micronutrient status alongside nitrogen inputs is a practical step towards more effective crop nutrition.
Tissue testing provides the most reliable means of identifying when micronutrients are limiting performance, allowing targeted correction that improves nitrogen use efficiency.
Molybdenum availability declines in acidic soils.
Manganese deficiency is often associated with limed soils, high organic matter, or oxidising conditions.
Magnesium supply may be compromised in lighter soils or where high potassium applications restrict uptake. Iron generally has good availability across UK soil types.
“Tissue testing and soil analysis can help identify deficiencies before they limit nitrogen conversion, supporting both yield and quality,” notes Joel Williams.
Nitrogen forms and energy costs
The form of nitrogen supplied to plants determines how much carbon is required to process it into functional molecules, explains independent crop and soil expert Joel Williams.
The table below explains how much carbon a plant must spend to assimilate different forms of nitrogen into its metabolism.
These costs are measured as grammes of carbon used per 1g of nitrogen absorbed.
Nitrate requires significant carbon and energy to reduce to ammonium.
Converting 1g of nitrate can require approximately 5.8g of carbon.
Feeding the plant ammonium is more efficient because it is in a more usable form for plants.
“It requires less energy to assimilate, using about 4.32g of carbon per 1g of nitrogen,” says Joel.
However, he notes excess ammonium can be toxic to plants.
Organic nitrogen sources, such as amino acids, can be even more efficient because they contain embedded carbon within their structure.
For example, glycine has a net assimilation cost of about 2.16g of carbon per 1g of nitrogen, while arginine costs about 3.02g.
“These molecules provide a ‘carbon bonus’, saving the plant energy which can instead be used to support both shoot and root,” says Joel.
“Using balanced nitrogen sources and supporting soil organic matter can help crops use nutrients more efficiently and direct more energy towards growth and yield.
“Considering the carbon costs can improve growth and reduce wastage,” he says.
Assimilation costs for different N sources in g of carbon per 1g of nitrogen |
|||
|
N source |
Gross C costs |
C bonus |
Net N assimilation C cost |
|
NO |
5.81 |
0 |
5.81 |
|
NHA |
4.32 |
0 |
4.32 |
|
GIA |
4.30 |
2.14 |
2.16 |
|
Arg |
4.30 |
1.29 |
3.02 |
|
Source: Zerihun et al (1998) |
|||
Typical nutrient use efficiency for various crop nutrients |
|
|
Nutrient |
Efficiency (%) |
|
Nitrogen |
30-50 |
|
Phosphorus |
15-20 |
|
Potassium |
50-60 |
|
Sulphur |
8-12 |
|
Zinc |
2-5 |
|
Iron |
1-2 |
|
Copper |
1-2 |
|
Manganese |
1-2 |
|
Boron |
2-3 |
|
Molybdenum |
2-5 |
|
Source: Sarkar et al (2021) |
|