
Expert advice on managing arable fixed costs to improve margins
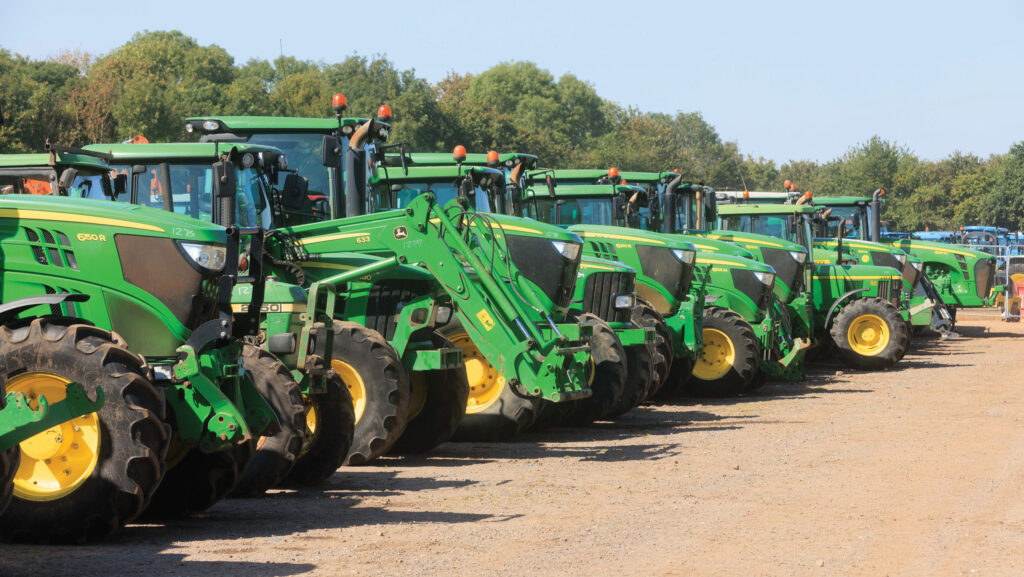 © Cheffins
 A greater focus on labour and machinery costs, including depreciation, will potentially lead to a better arable net margin.
With no standard format for labour and machinery costs they often get far less scrutiny than variable costs, being considered fixed and difficult to measure or adjust, says Gary Markham, director of farms and estates at adviser Land Family Business (LFB).
“The total annual cost of labour and machinery and harvest-based variable costs on our benchmarked arable farms are actually very similar, at around £667/ha,” says Gary.
See also: Readers’ tax, finance, management and legal questions answered in FW’s Business Clinic
The businesses advised by Land Family Business are mainly arable units of between 320ha and 415ha.
Benchmarking shows labour and machinery costs on these farms seem to have a greater influence on arable net margin than variable costs, with the gross margin difference between the top 25% and bottom 25% at £447/ha, while the net margin difference after labour and machinery costs is £702/ha.
Arable gross and net margin comparisons for benchmarked enterprises* (£/ha) |
|||
|
|
Top 25% |
Average |
Bottom 25% |
|
Arable output £/ha |
1,769 |
1,510 |
1,426 |
|
Gross margin £/ha |
1,045 |
793 |
598 |
|
Arable net margin £/ha |
400 |
141 |
-301 |
|
Source: Land Family Business |
|||
Depreciation
This is not a cash cost but is directly proportional to the value tied up in machinery. It should represent the annual reduction in value of assets, thereby quantifying the annual cost to the business.
Depreciation has no connection with tax, it is purely a function of management accounting that helps in decision making. Machines are recorded in a fixed asset register.
The accepted way to account for depreciation is to use an average annual percentage drop in value, by one of three methods.
1. Reducing balance depreciation
This is the most common method and reduces the value by a percentage on the remaining balance each year. If the correct percentage is used then the balance each year should represent a realistic reduction in the value of machinery in a business. However, the 25% rate often used is too high, says Gary, who suggests more realistic percentages as:
- Combines and tractors 15%
- Equipment 20%
- Vehicles 25%
- Office or general IT equipment 30%.
“Using these percentages on a reducing balance basis should provide a realistic balance of values in the annual accounts. As a shortcut, a weighted rate of 18% will provide a realistic result across all machines.”
2. Straight line depreciation
This method reduces the value at a fixed percentage of the original cost each year.
For example, a 20% rate would reduce a machine to a nil value over five years and the machine would therefore be included in the annual accounts as nil at that point.
“This is not realistic as obviously the machine still has a resale value often used as a part-exchange, so using this method in farm accounts is misleading,” says Gary.
3. Current cost accounting depreciation
This third method is widely used by those providing industry economic reports.
A depreciation charge is used to reflect the reduction in value of the machine but an additional cost is also included to build up a fund to eventually replace the machine.
Both of these costs charged in the accounts are not cash costs. “This method has its place but again would be misleading in annual farm accounts.”
Profit or loss on sale of assets
This is simply the difference between the depreciated value of a machine in the farm records (the fixed asset register) and a sale price, usually as a part-exchange.
This is where the method and percentage rate of depreciation is important, says Gary.
© GNP
For example, if a machine has been depreciated on the straight-line basis and after, say, five years its value is recorded as nil, then when it is part-exchanged its full value will be a profit on sale.
Second, if say a 25% depreciation rate is used in the reducing balance method, again the machine’s book value will be lower than its sale value.
So, if the farm accounts regularly show profits on sale of assets, it is likely that the incorrect method and/or too high a deprecation rate has been used.
Costing machinery capital
Calculating the total annual cost of machinery capital in a farming business is difficult because there are usually three different categories to consider and each business will have differing proportions of each:
- Depreciation, on a reducing balance basis, is the annual drop in value of machinery owned including machinery on hire purchase
- Contract costs – the cost of engaging contractors to carry out work on the farm
- Hire costs – for example, hiring high-horsepower tractors for short periods, or the annual hire of combine harvesters.
The answer is to use a different benchmark – access to machinery – comprising:
- Annual depreciation of owned machinery
- Contractor costs for arable production a year
- Annual machinery hire costs.
The annual total of these on a per-acre basis can be used as a meaningful benchmark.
Machinery – key benchmarks
The capital value of machinery per acre used for crop production can provide a very strong indication of the viability of a farming business.
While arable gross margins have declined over the past few seasons, the capital value of machinery has increased markedly.
Land Family Business benchmarking shows the capital value of machinery increasing from £692/ha in 2022 to about £926/ha for the 2024 harvest and rising to £978/ha for the 2025 crop.
This capital value is represented by its annual depreciation charge in farm accounts and budgets.
The increase is a combination of huge machinery price inflation, high second-hand values and, to some degree, higher rates of investment, sometimes tax-led, says Gary.
A capital value of £978 per acre at 18% weighted depreciation gives an annual depreciation charge of £176/ha.
The two key elements of profitability in arable enterprises will be:
- Machinery capital
- Tonnes produced per acre.
Gary recommends the following key benchmarks:
- Depreciation no greater than £148/ha for 320-415ha arable enterprises
- Access to machinery max £309/ha
- Access to machinery per tonne of wheat max £36
- Machinery capital max £865/ha
- Machinery capital per tonne of wheat max £100.
Despite its wide use in farm business management benchmarking, Gary rejects cost of production per tonne as a useful measure.
“Production economics do not provide linear results.
“For example, if an arable crop is calculated at a greater cost to produce than the value of a tonne of output, removing that crop from the rotation will not reduce many of the costs allocated to it on a full-costing basis – these costs are merely moved to other crops.
“Also, this methodology excludes any residual benefit a crop may have on the following crop.”
Cost of an extra pass
Using standard tillage operational valuations or costings to assess the cost of an extra pass leads to incorrect conclusions, often overstating the cost, he says, recommending that the actual cost of an extra pass be calculated as:
- Fuel
- Additional labour costs – only if in overtime
- Some additional hours on tractors
- Wear and tear on machinery
- The effect of timeliness on other operations.
“The cost of fuel is easily quantifiable. Often there is no additional labour cost if the work is carried out by employed labour in non-overtime hours.
The additional hours on tractors is negligible, also wear and tear on the machinery. The knock-on cost on timeliness based on one additional pass can often be negligible.
“Costings using standard valuations often result in overestimated savings, leading to incorrect management decisions, such as not carrying out an operation.”
Managing negative margins from contract farming
Contract farming agreements have usually included BPS in the agreement, typically providing a fixed fee for the contractor plus a calculated bonus or profit share of the surplus, resulting in the BPS element being shared with the contractor.
The loss of BPS has made many of these arrangements unprofitable for the contractor.
“LFB benchmarking results clearly show that on average, farmers who contract additional land do so on a negative margin.
Therefore these arrangements are now merely a contribution to labour and machinery costs.
“However, if those operating at a negative margin on contract farmed land gave up the arrangements they would be worse off in profit and cashflow terms than continuing, unless they address the loss by restructuring their labour and machinery,” says Gary.
Machinery sharing
Many farming businesses are already sharing some or all machinery with others, reducing costs significantly. This is in a formal separate joint venture know as a machinery syndicate.
There is still great scope for more of these arrangements, says Gary Markham of Land Family Business, but every situation will have differing factors, and individual advice is needed, especially on the tax implications and to help identify the most suitable trading structure.