
Forage analysis and how to interpret results on-farm
 © Tim Scrivener
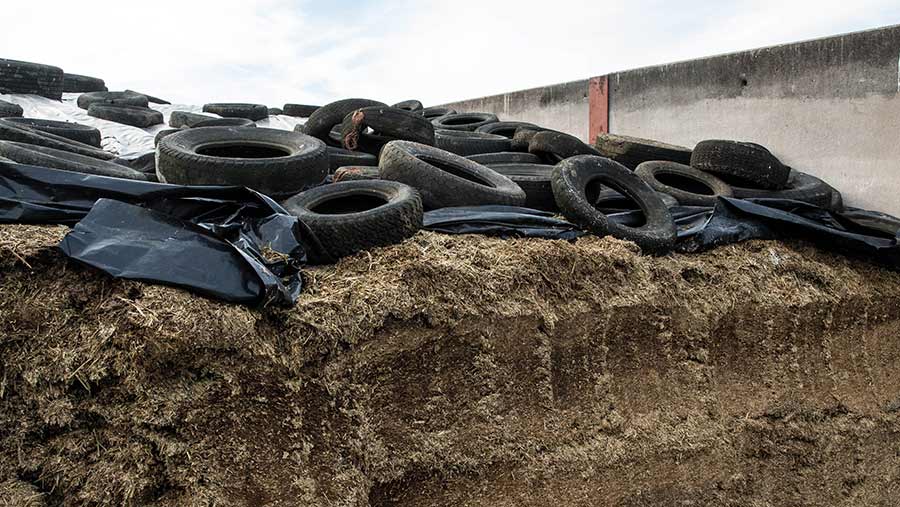
 Forage analysis plays a vital role in feeding and management decisions. Understanding the analysis process and being able to interpret sample results will help farmers better utilise their forage – reducing waste and increasing productivity.
To find out more about the analysis process itself, we spoke to Ruth Lawson, technical manager at Carr’s Billington, independent nutritionist Hefin Richards of Rumenation Nutrition Consultancy and David Atherton who runs Thomson and Joseph, an independent forage analysis business.
He and his team handle sample logistics between farm and lab and, importantly, provide an interpretation of what the data means for farmers.
Dr Ruth Lawson © Sophie Smith
See also: 4 tips to manage the risk of dry silage
Types of forage analysis
There are two key types of analysis:
- Feeding-value analysis, which looks at energy and protein values, and fermentation characteristics, which determine the extent to which cattle will actually consume the forage and make use of it
- Mineral analysis, which identifies and quantifies major minerals and trace elements.
Feeding-value analysis
Feeding value is established via near infrared spectroscopy (Nirs) analysis, which is a predictive process. In a nutshell, the sample is scanned with a form of light and the levels of energy and protein-yielding nutrients are predicted from the reflected light against known calibration.
Mineral analysis of forage
The mineral analysis uses a direct form of analysis to look at the level of seven essential major minerals, such as calcium, phosphorus and magnesium, and eight trace elements, including iron, manganese, copper and zinc, within a sample.
- It begins by drying the silage overnight in a forced draught oven to produce a totally dry sample
- It is then ground down into a homogenous sample before going into a microwave acid digester for 30min to break down all the organic matter, leaving only the minerals
- Finally, the mineral sample is diluted and put through an analytical technique used to detect chemical elements. An extremely hot flame is then applied which excites the electrons in the outer shell of the element and, as they move back to their normal state in the cooler part of the flame, the technology picks up the radiation emitted, to identify the specific minerals present and their concentration.
On-farm sampling advice
Get a representative sample taken using a corer in a W-shape at several sites across the clamp, not just the clamp face. Ideally, get it analysed before you start feeding it. If you cut it in May but don’t plan on feeding it until October, take a sample mid-summer.
But if you plan on feeding sooner, make sure you allow enough time to get it analysed.
From then on, you can take monthly samples to detect changes in the silage as you move through the clamp, or just sample when you are moving to a different clamp. How often you test will depend on a number of factors:
- If you fill the clamp in blocks and then open the clamp, the first thing you feed will be the last field you harvested. Therefore, as you progress through the clamp, you will be dealing with different silage from different fields. In this instance, you need to test more regularly
- If you fill the clamp in layers, from the bottom to the top, the variance will be less and therefore, regular testing may not be required
- If one clamp will be open for a long period (five months), you may want to test it three or four times
- In a multicut system (where five to six cuts are taken), you would typically be working through cuts every two-and-a-half months, if you don’t layer cuts on top of each other. In this instance, it might not be necessary to test so often
- A good rule of thumb is to let the cows be your guide. If they are performing well do you need to check the silage and change the ration? Monitor milk production, cow condition and health, which could suggest when something is wrong with the ration and further investigation is necessary.
Interpreting results on-farm
Once the lab analysis has taken place, farmers will then be provided with the results to interpret and determine the nutritional value in their forage and any key areas that farmers and their nutritionists should focus on when looking at their silage analysis results will also be highlighted.
Three key aspects which the feeding value analysis will identify are the dry matter, metabolisable energy and crude protein of forage.
Nutrient targets |
||
|
Nutritional value |
Target |
Comments |
|
Dry matter (DM) |
25-35% |
Less than 22% is poor and more than 35% is too high. The moisture of forage is really important because if silage is too dry, cows are able to sort through the ration which can lead to issues like sub-acute rumen acidosis (Sara) and low butterfat. On the other hand, if silage is very wet, it can restrict cows’ DM intake. |
|
pH |
3.8-4.2 |
Although we are looking for a lactic acid fermentation, a very low pH indicates very acidic silage that could lead to Sara. A very high pH in clamp silage can point to poor fermentation, which could result in high butyric or acetic acid content, leading to poor intakes and potential butyric ketosis, particularly in early lactation cows. |
|
Metabolisable energy |
Consider class of stock: For example, dry cows/sucker cows 9.5 Dairy/growing cattle 11+
|
Metabolisable energy is affected greatly by time of cutting. It also gives an indication of the digestibility of the silage. |
|
Crude protein |
Three-cut system 13-16%
Multicut 16%+ |
Crude protein is a measure of total protein – both plant proteins and sources such as nitrogen fertiliser residues. Too high a level will make the ensiling fermentation more difficult. |
|
Ammonia-N |
<5% |
A value of less than 5% is an indicator of an excellent fermentation. However, beware of values above 5% N, which indicate poor fermentation and show the proportion of protein that has been broken down during ensiling. |
|
Sugars |
As high as possible |
High sugar is found in drier silage and can be prone to spoilage. Watch if DM is above 30% as you are more likely to get aerobic spoilage |
|
Neutral detergent fibre |
400-450g/kg |
Needed for good rumen function, but again, be aware of the levels in the sample as too much can slow digestion and reduce intakes |
|
Ash value |
<10% |
High ash levels can suggest soil contamination |