
How to calculate your poultry farm’s carbon footprint
 © Adobe Stock
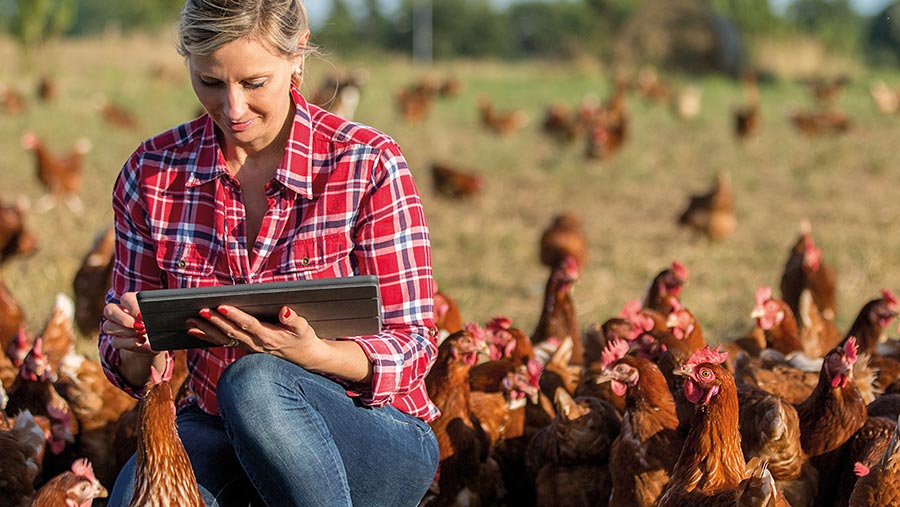
 Growing pressure to reduce emissions means calculating a poultry unit’s carbon footprint is likely to become a requirement, according to Promar environmental consultant Luke Briggs.
As well as a potential obligation, the sector has a responsibility to reduce its ammonia emissions, which account for 20% of the UK’s total.
See also: How poultry farmer minimised floor eggs to 0.5% at peak lay
But it is also financially sound, as reducing a carbon footprint is essentially cutting waste within the system.
So how do poultry producers go about calculating their carbon footprint and making agriculture part of the solution? The first step is to collect a high level of data across the farm, says Mr Briggs.
1. Data collection
Data can be collected from the farm’s most recent completed flock cycle, then annualised to calculate emissions each year.
“Producers need to set time aside to dig out the data – quality data drives a quality footprint,” says Mr Briggs.
Feed data is usually very detailed, because it can change up to 30 times within a flock cycle, and individual units should be able to get that data from the feed supplier.
Energy use is another big factor on poultry units.
Some farms have renewable energy sources, which will obviously affect their carbon footprints – so Promar needs to find out what the unit has, how long it has had the sources, whether they cover the requirements of the unit, and whether the energy is being exported.
2. Data verification
The next step involves independently verifying the data to ensure accuracy. If any data contains possible errors Promar goes back to the farmer to discuss the anomalies and clarify.
3. Calculating the footprint
The data is then fed into a footprinting tool. “We have tried a few different ones but we have settled on Eggbase,” says Mr Briggs.
There are free tools available for farmers to use themselves – but they can miss out on the data verification stage, which is important for getting the footprint right.
4. Feedback to the farms
Once the footprint has been calculated, the data is fed back to the farm.
Tom Gill, head of sustainability at Promar, says the process is not just about producing a number, but producing actions which can be used in the short, medium and long term.
Some of the issues raised can be complex. Producers need to know they can use these tools then act, but having an export strategy for manures isn’t necessarily dealing with the heart of the challenge, Mr Gill says.
“We need to look at the elephants in the room – even if the farm has a low footprint, there has to be an element of ‘what next?. It’s about actions, and we would identify and support those changes on farm.”
5. Solution values
Solutions might be things flockkeepers have thought about, but the data assessment supports the process and shows which actions make a difference.
Any improvement steps should be taken over a period of time as the footprint can vary flock to flock and year to year. Farmers should use the baseline to take action.
Value of emission reduction on free-range egg units |
||
|
Option |
Potential emissions reduction |
Comments |
|
Covering litter and manure storage |
2.5-3% |
Prevents direct emissions of nitrous oxide and methane during storage |
|
Reducing layer casualties to less than 8% |
0.5-2%
|
Increases number of productive birds during flock cycle. The same total emissions are spread across greater production volumes, lowering emission intensity |
|
Increasing laying rates by 5% |
5% |
The same total emissions are spread across greater production volumes, lowering emission intensity |
|
Prolong laying cycles |
2-5% |
Increases productive life of hens, allowing for total emissions to be allocated over a longer flock cycle |
|
Closely monitor and review protein content in rations, and reduce if possible |
1-5% |
Unused protein lost in hen manure increases risk of nitrous oxide emissions from manure storage and application |
|
Installing renewable energy capture and storage on farm (for example, batteries) |
2-4% |
Removes emissions from fossil fuels associated with purchased energy use |
|
Exporting manure to an anaerobic digester |
5-7% |
Removes both direct and indirect emissions of nitrous oxide associated with storing and spreading manures |
|
Source: Promar |
||
Improving productivity without significantly increasing inputs is the way forward, says Mr Gill. This may be through reducing casualties, improving health and welfare and prolonging flock laying cycles.
A study undertaken by the British Free Range Egg Producers Association (Bfrepa) and Promar shows that feed comprises 88% of the average laying farm’s footprint.
Look at phased feeding for the stage and growth of the bird, targeting protein at the right level and balancing that with amino acids in the ration – as well as minimising soya where possible, he suggests.
But it’s important not to demonise all soya as the same, says Mr Gill, who points out that the crop can be produced sustainably.
“It’s about engaging with the feed company to adapt where possible to different stages in the growth cycle.
“A young growing bird will have a higher energy requirement than an older bird and there’s a tipping point – between 38 and 42 weeks – we don’t want this to negatively affect health and welfare so it is a balancing act.”
There are actions which can be taken on the range too. Trees and shelter belts will mitigate ammonia emissions, sequester carbon, and encourage healthier ranging habits. “There are a lot of wins which can be taken.”
6. Using key performance indicators (KPIs)
Monitoring environmental KPIs can support the business KPIs, such as gross margin. “These KPIs could be used to enrich the positive contribution the farm is making to net zero,” says Mr Gill.
Indicators of environmental sustainability |
|
|
|
Indicator |
|
Emissions |
Emissions of carbon dioxide equivalent per kg of eggs |
|
Biodiversity |
Percentage of tree cover on range / area of wildflowers or habitat planted for pollinators |
|
Energy use |
Energy usage (kWh) per kg of eggs produced Proportion of energy obtained from renewable sources |
|
Water use |
Water use per kg of eggs produced or per hen |
|
Air quality |
Ammonia emissions per kg of eggs produced or per hen Percentage of sheds with planted hedges to buffer and screen ammonia emissions |
|
Litter and manure |
Percentage of litter stores covered Percentage of litter stored more than 50m away from watercourses Percentage of litter stored on hard standing surfaces |
|
Land use |
Percentage of soya meal sourced from sustainable certified sources through the Roundtable on Responsible Soya (RTRS) |
|
Source: Promar |
|
What is Eggbase and how does it work?
Eggbase is one of several systems available that can produce a carbon footprint for individual flocks.
Emissions are measured by kilos of carbon dioxide equivalent (kg CO2e) a bird for broilers, and kg CO2e of egg for layers.
Footprints can be very different from farm to farm. It depends on how the flock is managed, the size of flock and the breed of bird – there are many variables, says Anne Fleck, managing director at Eggbase.
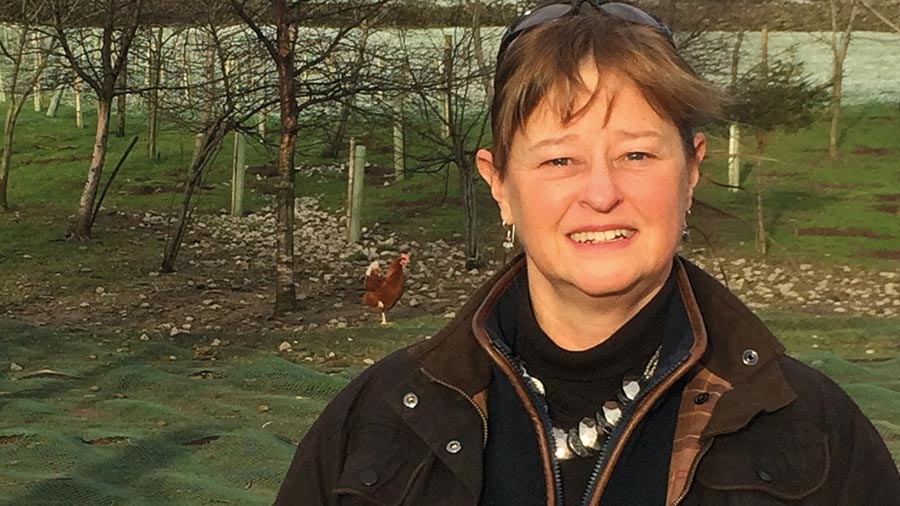
Anne Fleck © Eggbase
The carbon footprinting tool is integrated within the Eggbase benchmarking platform, with data from producers feeding into the footprint calculation.
Eggbase also works directly with feed suppliers to inform the feed component of the footprint.
About 10 different components, such as manure, fuel and electricity – each with its own carbon calculation – are then aggregated to produce the final footprint.
The boundary of the carbon footprint is the poultry unit itself.
“We look at sequestration on the range only; the boundary is just the poultry unit – not the farm as a whole – but the footprint can be used within the context of the whole farm footprint or the supply chain of the eggs or birds.”
Once the data is gathered an end-of-flock carbon footprint is produced. The footprint then builds as the flock ages – as long as the producer is keeping the figures up to date.
The system also allows producers to benchmark against other farms. This allows for peer support and conversations around where improvements can be made.
Explore more / Transition
During the series we follow our group of 16 Transition Farmers through the challenges and opportunities as they seek to improve their farm businesses.
Transition is an independent editorial initiative supported by our UK-wide network of partners, who have made it possible to bring you this series.
Visit the Transition content hub to find out more.