How grain nutrient analysis is improving nutrition programmes
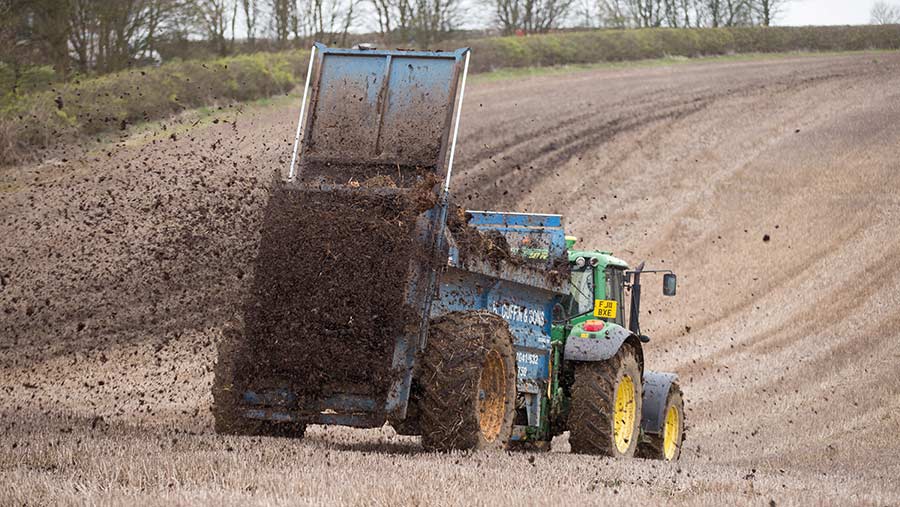 © Tim Scrivener
 The first year of comprehensive grain nutrient analyses from farms taking part in the YEN Nutrition initiative suggests there is a substantial “farm factor” difference between participants, alongside high numbers of grain samples below the phosphorus level thought to be required for yield not to be limited.
The results also seem to suggest regional clusters of nutrient deficiencies of some key macronutrients (see panel).
See also: Tackling rust and chocolate spot in beans post chlorothalonil
YEN Nutrition involved about 150 farms providing grain samples, usually from six fields, of any crop for grain nutrient analysis, explains Roger Sylvester-Bradley, head of crop performance at Adas, who leads the Yield Enhancement Network (YEN).
Grain nutrient analysis, he believes, can be an important and accurate measure of crop nutrient capture and offtake, helping growers judge the success of applications and ultimately help refine nutrient management.
“Very few assess the success of their nutritional programmes, yet nutrition costs growers more than any other input, and has big uncertainties,” Prof Sylvester-Bradley says.
Since 2020, the AHDB Nutrient Management Guide (RB209) has suggested using grain analysis for phosphorus as a useful measure of assessing capture and offtake.
Adding analysis of 11 other key nutrients costs little extra on top and, having successfully launched the concept of post-mortems of the previous season with YEN, benchmarking and sharing of data for nutritional programmes through grain analysis are parts of the YEN Nutrition project, Prof Sylvester-Bradley says.
Results from around two-thirds of the 900 grain fields signed up for the project have been analysed, with most being wheat and barley crops.
Farm factor
One of the first things that has jumped out of the analysis is the “farm factor”, says Prof Sylvester-Bradley. “We knew from analysing data from YEN there is a farm factor for yield, but we now know there’s also one for nutrition.”
The farm factor means that if a farm has high nitrogen in its grain for wheat, it is also likely to have high nitrogen for barley and other crops, he explains. “But what we don’t know yet is if the farm factor for nutrition is causing the farm factor for yield.”
While further analysis of the YEN data has suggested some associations between high-yielding farms and things they do, Prof Sylvester-Bradley believes the differences might be more to do with growers’ attitudes and motivations, and how that influences their management practices.
“We’ve come to the conclusion that it could be useful to ask growers to do psychometric tests to help understand this better.”
Just as in YEN where the use of organic manures appears to be associated with higher yields, a similar conclusion is being drawn from the first year of YEN Nutrition. Growers who used organic manures in this study tended to have higher yields, and Prof Sylvester-Bradley points out that organic manures contain multiple nutrients.
“But it was difficult to determine with the data set we have whether that was also associated with fewer deficiencies in grain nutrients,” he says.
Deficiencies were generally in the macronutrients, with the most common deficiency in grain being phosphorus. Of the 504 cereal samples, 65% were below 0.32%, which is the level in grain that RB209 suggests doesn’t cause any yield loss, he says.
“From the data we can start to work out yield loss from a level of deficiency. So for phosphorus when you get down to 0.25% you’re losing around 1t/ha in yield.”
Yield loss
Using this across all 504 cereal crops, the mean yield loss was 0.6t/ha, while the median value is 0.2t/ha – so 50% of the samples were losing less than 0.2t/ha, and 50% more, he explains.
The data gets more complicated when looking at the relationship between soil analyses for P and grain, he adds. “There’s not a good association with soil P. There are lots of farms which are reasonable for soil P and low in grain P, while there are a few with low soil P and high grain P.”
That points to a problem with crops taking up P, which is not very mobile in the soil, rather than the soils being deficient, he suggests.
“What you’re looking for is a well-aerated, moist topsoil with lots of roots and mycorrhizae. Unfortunately, we’re not very good at maintaining our topsoil in a fit state for that to be the case.”
Understanding how take-up of P could be improved is likely to need experimentation, he suggests. “What we desperately need is growers to do some testing.”
That could involve, for example, growers with fields where grain is low in P applying a huge quantity of P to small patches, to contrast with the rest of the field to see if they are truly deficient, he suggests.
The formation of nutrition clubs he hopes will pave the way for this and other experimentation.
Are there regional differences?
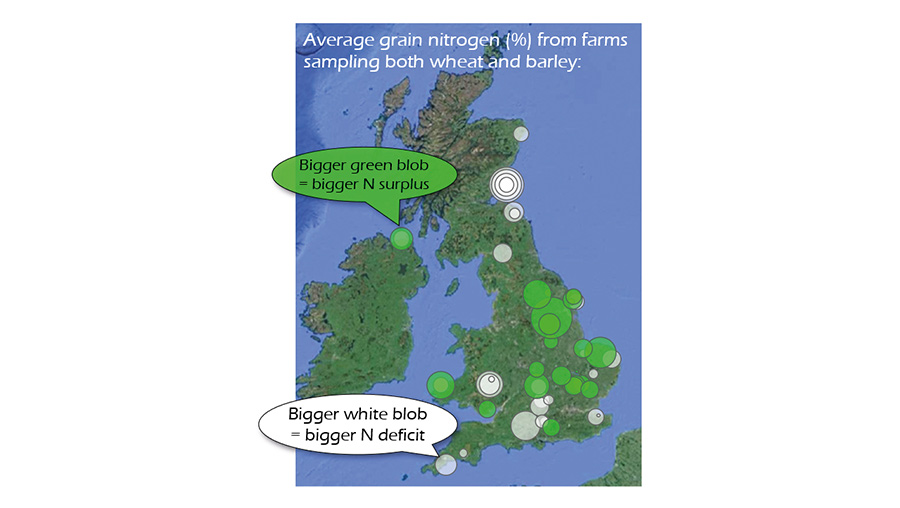
Analysis of the data across the country for the 57 farms where both wheat and barley crops were submitted suggests that there could be differences between regions in macronutrient values in those crops (see chart).
“There appear to be regional clusters where macronutrient levels in grain are lower or higher than average,” Adas’s Roger Sylvester-Bradley says.
They are not quite the same for all macronutrients and he says it’s not clear why that is, although it could be associated with livestock and manure use, and perhaps more diverse rotations.
Overall, the data for 2020 are also showing that there was a tendency to over-apply nitrogen across the country, however, he adds.
From the grain analysis, 60% were applying more than optimal last year.
While that might have been partly due to the lower yields and over-optimistic applications before the extent of the spring drought became apparent, there is a farm factor involved, he says.
“The evidence suggests whole farms need to look at their farm strategies. Generally we are finding that if they are generous with nitrogen on their wheat, they are too with their barley.”
Micronutrient deficiencies have been harder to pick up through grain analysis, he notes. The exception was manganese where 14% of wheat crops were deficient, which increased to 87% of barley crops.
Manganese in barley clearly works differently to manganese in wheat, in that there is less in the grain typically. “It’s not clear at the moment if that means it is deficient or whether barley is more efficient.”
What are the 12 essential crop nutrients? |
||||
|
Nutrient |
Important in wheat crops for: |
Critical threshold for grain dry matter in winter wheat |
Level of certainty about threshold |
Deficiency occurrence in wheat grain samples from 2020 |
|
Nitrogen* |
Growth |
1.9% |
Reliable |
12% |
|
Phosphorus* |
Energy for growth |
0.32% |
Reliable |
75% |
|
Sulphur* |
Yield and quality |
0.12% |
Reliable |
12% |
|
Manganese** |
Photosynthesis |
20ppm |
Reliable |
14% |
|
Magnesium* |
Green leaf duration |
0.08% |
Uncertain |
18% |
|
Potassium* |
Water regulation |
0.38% |
Uncertain |
5% |
|
Copper** |
Pollination |
2ppm |
Uncertain |
1% |
|
Zinc** |
Enzyme reactions, N metabolism and protein synthesis |
15ppm |
Uncertain |
1% |
|
Calcium* |
Cell wall structure |
— |
Unknown |
— |
|
Iron** |
Photosynthesis |
— |
Unknown |
— |
|
Boron** |
Pollen viability |
— |
Unknown |
— |
|
Molybdenum** |
Enzymes in N metabolism |
— |
Unknown |
— |
*Macronutrients **Micronutrients