Why yield mapping is first step in bridging BPS income gap
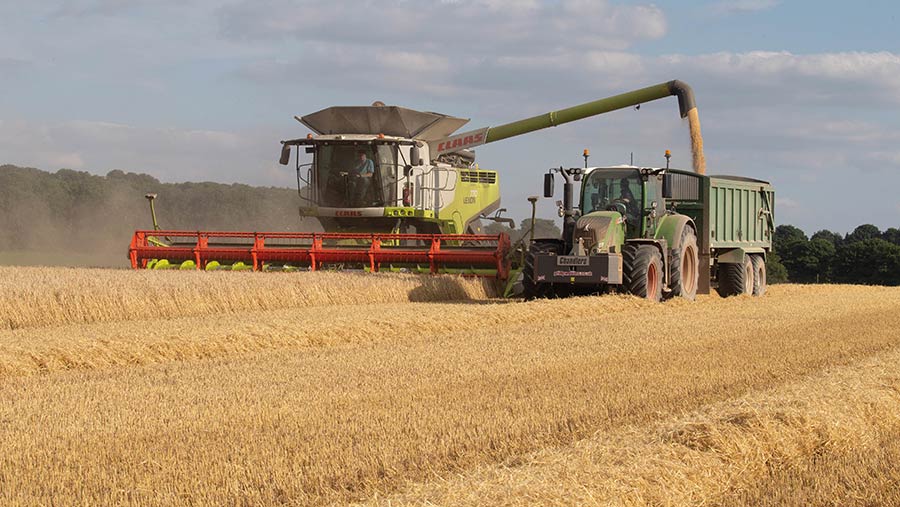 © Tim Scrivener
 Change is coming with the loss of basic payment scheme payments forcing arable businesses to look at ways of bridging this income gap, which may involve bold changes like overhauling the cropping system to slash costs, share machinery with neighbours or even stop cropping some fields.
Arable farmers in particular will need to grapple with this loss of income being the sector that is most dependent on direct support payments, with 79% of the average combinable crop farm business income coming from that source, according to AHDB analysis.
It almost certainly means that most businesses will need to make some changes in the coming years to cope with the loss of at least 50% of BPS by 2024, with the payments phased out completely by 2028.
See also: How a data analyst is improving 4 arable businesses in Norfolk
Much of that direct funding is planned to be redirected into new schemes with Environmental Land Management (ELM) taking top billing.
But there is a danger the industry wants to believe it will be able to substitute £1 of BPS with £1 of ELM or environmental stewardship, says Sebastian Graff-Baker, a partner in farm consultancy business Andersons Midlands.
It is flawed thinking for two reasons, he says. The first is the cost for applying for BPS to a farm business is about 0-5p/£1, whereas the equivalent cost of environmental stewardship, he estimates, is 30-60p/£1.
“Therefore, the contribution to profit from the enterprise of environmental stewardship is between 30% and 60% of the gross income, whereas the margin on BPS is 95% of the gross income.”
The second reason is the indirect cost from foregone contribution to profit from land that would otherwise be delivered from growing a cash crop, he says.
“The notion you can replace BPS with environmental stewardship may, depending on the nature of the land, be flawed because you have to give up land to deliver the requirements of environmental stewardship, but don’t to collect BPS.”
The costs of delivering environmental stewardship can increase or decrease above 30-60p/£1, depending on the contribution to profit that land was making from cash cropping, he says.
Identifying most profitable future use of land
- Three types of land
- Better understanding needed of yield variability across and in fields
- Yield mapping is a key tool
- Decide which areas suitable for stewardship
Types of land
Fundamentally, he says there are three types of land:
- Land that should generally always make a contribution to profitability without any support payments
- Land that is very unlikely to make a contribution
- Land that may do, depending on yield, weather, crop and rotation.
On land that could deliver a profit, the costs of delivering environmental stewardship will increase above 30-60p/£1.
Conversely, the land that never reaches break-even is costing money to continue growing that crop, therefore, the margins available from environmental stewardship on that land is higher because the costs of collecting it are less because you have a saved cost from not growing a low-yielding cash crop.
Preparing for reduced or changed support, therefore, means that many growers, and the industry at large, will need to understand the variability of yield across and in fields better than they do now.
With that understanding will come better decision-making about future land use.
“This is far from simple and may require development of analysis methods, but how we judge yield variability currently is not very sophisticated.
“In most cases, we might describe fields as good or bad, or perhaps good and poorer parts of fields.
“If our understanding of yield variability can improve, we then have the chance to do something about it.
“The default currently is if in doubt, let’s crop it and we can subsidise that activity with BPS. That’s going to need to change.”
Using yield maps
Identifying yield variability and its impact on profitability is likely to be improved by use of yield maps and bringing other data to support the creation of margin maps (see “Identifying marginal land”, below).
But, in the absence of the analytical wizardry required to do such analysis, Mr Graff-Baker believes growers could use their experience, preferably in conjunction with yield maps, to categorise the farm and fields into yield bands.
“Many businesses will have several years of yield maps, and with the farmer’s experience can eliminate certain things that are seasonal or crop-specific that are not indicative of the underlying performance of the land.
“If you rule those out, the remaining variation is indicative of the current performance of the available land, and I think there is a point where farmers can divide fields and parts of fields into bands of percentage of the average yield, as a first step towards improving business performance.”
His suggestion would be to split fields into no more than 10 yield bands ranging from 50% above or below the average.
“And then with those yield bands in mind, if you impose future cropping plans, budgeted yields, operating costs and increasing input costs, one can get an idea of what parts of the farm are generating contributions to profit, and what parts are generating a cost to profit as a result of continuing with cash cropping.
“While it would be nice to wait for digital tools to be developed to help with even more accurate analysis, there is a real benefit financially form addressing this in analogue way.
“We can make real progress by describing the farm as best you can now,” Mr Graff-Baker suggests.
Once that process has been undertaken, that will help identify areas where environmental stewardship should be considered, he says.
“There may be areas where that makes sense for the farm.”
It is also likely to highlight that headlands, and areas of fields where fieldwork is difficult, are likely to be a cost to profit.
Farming in straight lines, taking out headland and squaring-off fields will make sense for many farms and businesses.
Identifying marginal land
An AHDB project is aiming to use multiple years of yield map data, together with operation and input costs to create margin maps gridded to 15sq m areas, with the aim of helping future decision-making on the AHDB Strategic Farm in Suffolk.
The farm’s host, Brian Barker, has about 10 years of yield mapping data, says David Clarke, soils and farming systems technician for Niab, which is leading the project.
“Having that long-term data set helps as you have numerous years, different weather patterns and across the rotation information to analyse,” he says.
Starting point
“The first step is extracting the data so we can analyse the entire data set rather than just in one year, and cleaning it to remove any anomalies.”
The data will then be broken down into approximately 15sq m grids, so any yield point in that grid will be referenced to that grid point, with the mean worked out from multiple points falling in the same grid.
All the operations and inputs to that field that year can then be attributed to that grid as well, he adds. “We can build up a picture of the variable costs used to produce that yield.”
As Mr Barker isn’t using variable rates within fields, but does between fields, the process is relatively simple, as the variable costs are going to be similar across a field, Mr Clarke suggests.
“Where we have reduced yields, the margins are likely to go down.
“However, that area might be different for spring beans compared to winter wheat, so it is important to look across the rotation and also at long-term weather data.”
ELM scheme
One use of the maps will be to help Mr Barker with decision-making over future use of land when Environmental Land Management (ELM) schemes are launched.
“It’s about helping farmers minimise the costs of implementing ELM schemes, but also being aware of how much it is potentially costing them in terms of loss of income.”
For example, if, under the Sustainable Farming Incentive, areas of land are required for environmental stewardship on an annual basis, the maps can be used to look for areas with likely poor contribution to profit depending on prospective cropping.
“Those areas might change depending on whether it is a spring-drilled crop or a winter wheat, for example.
“And then there are those areas across the rotation regardless of crop and season that tend to perform poorly every year, which might be suited to being taken out of production for longer periods, perhaps as part of local nature or landscape recovery elements of ELM.”
Online tool
Other resources can also be pulled in to help, such as the UK’s Centre for Ecology and Hydrology’s Assist e-planner, which helps identify the most suitable environmental use for land being taken out of production.
But the analysis also has an agricultural benefit, he suggests.
“This type of analysis will help identify areas that might benefit from a system change or management.
“For example, fields that always perform poorly as spring crops, you might be able to change the rotation to avoid that.”
The project will be completed this year, with a view of using the outputs and methods at the Strategic Farm and the learnings rolled out more widely.
Overheads
The farm’s overheads must be considered as part of this analysis, he stresses.
“If overheads are considered fixed, it will fundamentally limit possibilities, so leaving open the potential of redesigning overhead structures, which will be crucial if we are going to generate enough profit with environmental stewardship rather than BPS as the source of continuing support.”
By identifying the most profitable future use of land, you can identify what resources of machinery and labour will be required to deliver that, how much is available to spend on it, and then consider what is the cheapest way of acquiring it.
“Effectively, you’re giving yourself a budget for acquiring labour and machinery, and if you can do that from your own dedicated labour and machinery – great.
“It might just be changes in the existing structure rather than replacing with a new one, or it might be quite different to the current situation.
“One way of approaching this is thinking as though you have come on to the farm for the very first time, perhaps as a prospective tenant calculating an affordable rent.”
For most, Mr Graff-Baker believes some sort of sharing arrangement for labour and machinery is perhaps likely to be the best solution.
Where a greater proportion of land is in environmental stewardship, typically it would mean less horsepower is going to be needed, he notes.
“But it may mean your farming operations happen in a shorter period of time to get the technical performance, which could mean the opposite.
“That rather suggests that for some this isn’t a model for dedicated exclusive ownership, but co-ownership, hiring in or sharing in some form,” he concludes.
The Bridging the BPS Gap
The Bridging the BPS Gap series will look at ways of plugging the income gap including:
- Adopting regenerative ag
- Collaborate more/share farming
- Maxing out stewardship schemes
- Making the rotation pay