How precision farming can earn an extra £99/ha
 © Gary Naylor
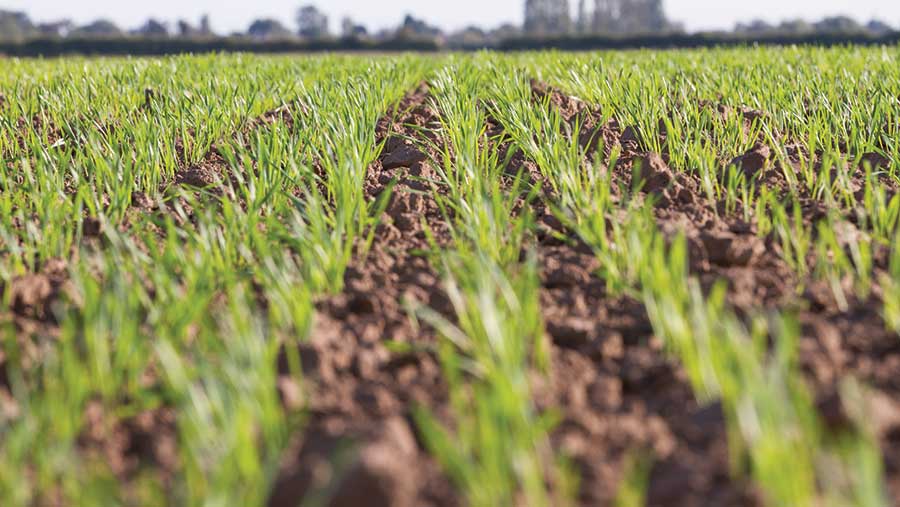
 A trial carried out across three farms in the Midlands shows that precision farming can pay – even fields that farmers believe to be fairly even are seeing yield benefits.
Most fields have poorer-yielding areas. It could be an area of heavier soil where germination rates are lower or perhaps a slug or blackgrass hotspot.
Whatever the reason, by treating the field as a whole with a flat-rate input, farmers are never going to get the most from these underperforming areas.
See also: 7 steps to successful subsoiling
So by varying inputs across a field, such as raising seed rates in areas with poorer germination, farmers can raise yields.
However, there is a perception that precision farming does not pay or that farmers need very variable soils within a field to see any benefit.
Split-field trial
To find out if this is the case, Hutchinsons established a split-field trial across three farms last season comparing the Omnia precision farming approach with normal farm practice in winter wheat.
It revealed that precision farming does pay, with an average yield increase across all three sites of 0.6t/ha.
The extra yield equates to £99/ha based on a wheat price of £165/t, which Nick Strelczuk, precision technology specialist at Hutchinsons, believes is a good return for the £5/ha annual cost of using Omnia.
This subscription enables farmers to generate input application plans using different layers of information, including crop biomass data – from drones, machine-mounted sensor and satellite – maps showing differing slug and blackgrass pressure.
Little soil variation
Of particular interest is that a yield increase was also seen in a field with little soil variation at Grove Farm, near Borne, Lincolnshire.
The trial field of Zyatt wheat consists mainly of marine clay. Half of the field was managed using Omnia precision farming and the other half followed standard farm practice.
Total seed and nutrient inputs were kept the same to allow a direct comparison between the two halves of the field, explains Mr Strelczuk.
The starting point was to generate a variable seed rate map. For this field it was based on three layers – soil texture, seed-bed conditions and blackgrass pressure.
“Some fields may have up to seven layers, but for this one three was ideal,” says Mr Strelczuk.
Seed-beds were scored by visual assessment (excellent, good or poor) and recorded in the field using a tablet with the Omnia mapping tool. The same had been done for blackgrass pressure.
For blackgrass, upping seed rates helps to increase crop competition and for areas where germination may be lower – for example, heavier soils and poorer seed-beds – upping seed rates will help even up crops.
Precision farming raised yields in a field with little soil variability at Grove Farm, Lincolnshire |
||
|
|
Farm standard |
Precision approach |
|
Seed rate (kg/ha) |
204 |
Average: 206 Range: 189-228 |
|
Nitrogen (kg/ha ammonium nitrate) |
312 |
Average: 312 Range: 265-348 |
|
Yields (t/ha) |
9.98 |
10.45 |
|
Cost of production (£/t) |
99 |
90 |
Seed map
Once the layers have been imported, farmers simply enter their target plant population, drilling date and the program will generate the drilling maps, he says.
For this field, which the farmer deemed to be even, seed rates varied considerably between 189kg/ha and 228kg/ha.
“It just takes a small difference in the inputs [soil type, seed-bed quality] to have a bigger effect on outputs like seed rates,” explains Mr Strelczuk.
Then in spring, crop biomass was mapped using satellite and the data was used to generate a fertiliser plan. The total nitrogen applied was the same for both halves of the field. The only difference was that the last split varied across the precision farming area.
Yield results show the half managed using the farm’s standard practice yielded 9.98t/ha, while the precision farmed area delivered an extra 0.47t/ha.
Crucially, this resulted in the cost of producing 1t of wheat falling by £9/t at Grove Farm.
Future
Buoyed by the statistically significant yield benefit of 0.6t/ha with a precision approach, the company is expanding the trial this season.
Mr Strelczuk says winter wheat has already been drilled across 10 farms and they are planning to look at spring cropping on a further 20 farms.
Case study: Frazer Jolly, Leicestershire
Trial at a glance
- Carried out on three farms in Lincolnshire and Leicestershire
- Fields split with half flat rate and half variable rate
- Variable seed, nitrogen, potash and phosphate
- Overall rates same for both treatments
- Statistical analysis carried out
Leicestershire farm manager Frazer Jolly is looking to adopt more precision farming practices next season after seeing a 1.4t/ha increase in wheat yield last season.
The field selected by Mr Jolly and his agronomist Sally Morris has a history of variable crop yields and his aim was to improve establishment of a crop of Illustrious wheat.
Looking at the wheat yield maps for 2016, the last time the crop was grown in this field, one end of the field outyielded the other. Oilseed rape grown the following year also showed variable performance, she says.
The field is predominantly sandy loam with a clay loam strip through the middle and a variable seed map was generated using soil type, seed-bed conditions and slug pressure.
Slug pressure was based on field knowledge, with a particular hotspot at the top of the field near trees. There is no blackgrass problem, so a weed pressure map was not needed, says Mrs Morris.

Agronomist Sally Morris and farmer Frazer Jolly
More even crop
Detailed plant counts revealed that the precision-farmed half had a much more uniform crop, while the farm standard had huge variation of 80-220 plants/sq m.
“There was a clear benefit using Omnia, with crop establishment being more even,” says Mr Jolly.
Again the biomass map was used to vary fertiliser and the end result was a 1.4t/ha yield lift in the crop of Illustrious wheat, which translated into an extra £231/ha when assuming a price of £165/t.
“The yield map from the John Deere system surprised us all. There was a clear line between the two halves of the field,” he recalls.
Mrs Morris also highlights that the poorest-yielding areas of the field back in 2016 were actually the highest-yielding areas in 2018.
Looking at the cost-of-production map, some areas were down at £81/t, while the highest was £160t.
“It was incredible to see the differences in cost on the map,” says Mr Jolly. “We need to do more of this [precision farming] to produce better crops in these poorer-performing areas.”
He is currently exploring options with a view to start variable seeding in autumn 2019 and he plans to run the trial again next year when the field is back in wheat, but switching the treatments around.
Precision approach reduced the cost of wheat production by £9/t at Saltby Farms, Leicestershire |
||
|
|
Farm standard |
Precision approach |
|
Seed rate (kg/ha) |
178 |
Average: 182 Range: 164-207 |
|
Plant counts (plants/sq m) |
80-220 |
150-230 |
|
Nitrogen (kg/ha Sulfan) |
404 |
Average: 404 Range: 365-462 |
|
Yields (t/ha) |
6.66 |
8.11 |
|
Cost of production (£/t) |
121 |
93 |
The different layers used at Saltby Farms
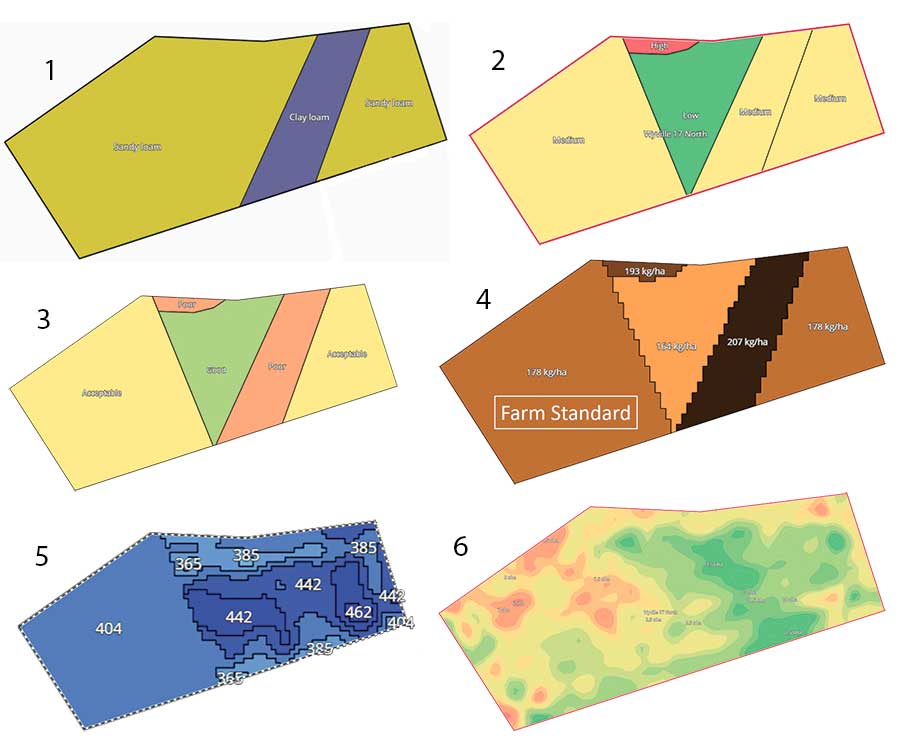
The soil texture (1), slug pressure (2) and seed-bed conditions (3) layers were used to generate the variable seeding map (4). The nitrogen map (5) was based on crop biomass measurements and the resulting yield map (6) showing the benefits of a precision approach.