
How mapping is saving a livestock farmer £2,120 on lime
 © HL Hutchinsons
 Yield and soil mapping is widely used in the arable sector, but with rising demand for the technology from livestock farmers growing forage, more contractors are now investing in it.
John Watson is one of the largest contractors covering the North West and southern Scotland and has invested in yield mapping sensors on two of his foragers at a cost of £20,000 each. He also has four tractors capable of using precision maps.
His clients are seeing the benefits of using such technology, with improvements in forage production and savings from more targeted spreading of slurry, fertiliser and lime.
See also: How livestock farms cut fertiliser use with precision system
One such farmer is John Cunningham-Jardine, of Tinwald Estate, Dumfries, who grows a mixture of grass, hybrid rye, maize and winter wheat which feeds his 1MW anaerobic digester (AD).
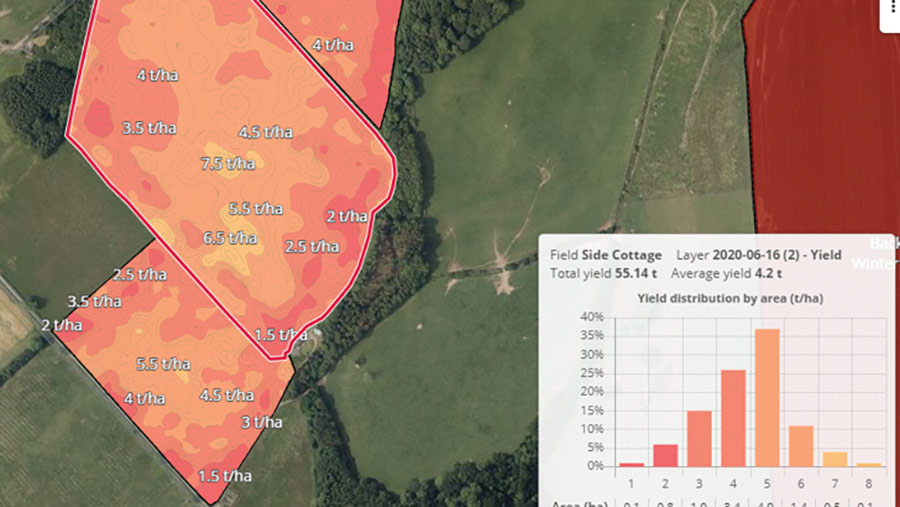
After noticing visual differences in the way crops were performing, he decided to yield-map all 365ha (901 acres) on his farm. He also soil mapped an initial 60ha (148 acres) of ryegrass using Terramap, from Omnia.
Results from his ryegrass analysis last year found that distance from the AD plant affected yield and the levels of some key nutrients.
Yield and soil variation |
|||
|
Field type |
3.2km away from AD plant |
Middle block |
Inner circle surrounding AD plant |
|
Average yield of block (t/ha) |
4 |
14 |
12 |
|
Potash index range (target 3) |
0-1 |
1-3 |
3-5 |
|
pH (target 6-6.5) |
5.2-5.9 |
5.9-6.8 |
5.6-6.5 |
The only limiting factors on these fields were potash and pH. It is thought the variation was down to the uneven application of slurry, with fields close to the farm and in the middle block historically receiving more digestate because of their proximity to the AD plant and the ease of using the umbilical slurry spreading system.
However, the field close to the plant had some areas that were more acidic, possibly because of soil type and leaching. Soil pH can have a big influence on the crop’s ability to take up nutrients.
Solutions and savings
To rectify the issue Mr Cunningham-Jardine plans to use a variable-rate lime application across his fields this spring. Lime is important because it reduces acidity, helping to unlock nutrients such as phosphate and potash.
John Cunningham-Jardine will use variable-rate lime application across his farm © John Cunningham-Jardine
Soil mapping showed that 77t of lime was required on the Italian ryegrass fields. However, if Mr Cunningham-Jardine had simply applied the lime at a standard flat rate of 5t/ha (2t/acre), that would have equated to 183t. Precision application will save him 106t of lime at £20/t, or £2,120 in total.
Hutchinsons agronomist Jim Clark, who works with Mr Cunningham-Jardine, says: “Having the correct pH between 6-7 will maximise nutrient uptake leading to increased production. If John can increase yields it may reduce the amount of feedstock he has to buy in for his AD plant.”
What is yield and soil mapping?
The related techniques of yield and soil mapping use sensor technology to gather information.
Yield mapping
- Gives an overall picture of how fields are performing
- Is conducted every time a crop is harvested, mapping how yield varies between fields and within a field.
- Helps inform when a field may need reseeding, for example
- Will not tell you, however, why a field is not performing.
Soil mapping
- Helps to explain why certain areas may not be performing
- Terramap is currently the most in-depth soil mapping technology available. It uses passive, gamma-ray detection to provide high-definition mapping of all 21 common nutrients, pH, soil texture, organic matter and cation exchange capacity (the soil’s ability to provide plant nutrients) as well as elevation and plant available water. The sensor measures naturally emitted isotopes, meaning the results are stable and repeatable
- It is recommended that fields are soil mapped once every four to five years
- It is easier and more accurate than taking physical soil samples, because the whole field is scanned rather than random plots being tested
- Does not measure compaction.
Data from both yield and soil mapping can then be used to:
- Formulate a plan to address any deficiencies
- Precision-apply nutrients rather than blanket application, which can save time and money and improve overall yields.
Mr Clark says most farmers are now capable of precision-spreading fertiliser themselves, provided they have weigh cells on the fertiliser spinner and a tablet to download software. Many contractors are now offering precision application as a service, with lime costing about £7/t.