How a grower is aiming for a 10% yield raise using a data tool
 Richard Cross © Tim Scrivener
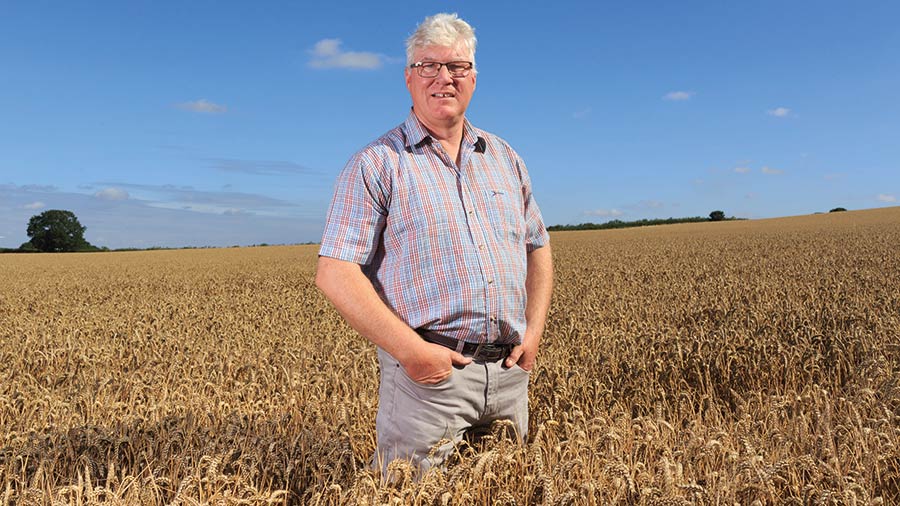
 A 10% lift in crop yields is the aim for one Nottinghamshire farmer trialling variable rate nitrogen applications in crops of wheat and oilseed rape.
Farm manager Richard Cross has good experience of using variable rate nitrogen in his previous role on a farm in Northamptonshire, using a N sensor to tailor applications according to crop biomass.
He is now looking to replicate that success at the Oxton Estate, near Southwell in Nottinghamshire, with the help of Bayer’s FieldView digital tool.
See also: Are perennial grain crops close to being a realistic alternative?
“We want to get every hectare yielding 10t/ha,” he says. “A key part of achieving this is putting nitrogen fertiliser where it is most needed, based on green area.”
Farm facts
- 700ha arable
- Soil types: sand land plus heavier keuper marl
- Wheat varieties:
- Light land – Skyfall and Montana.
- Heavy land – Gleam plus Lantern (second wheat)
- Cropping:
- Light land – rented out to Strawsons for vegetables plus milling wheat and maize for anaerobic digester
- Heavy land – feed wheat, winter malting barley and oilseed rape
Soil types
He points out that the farm is on two soil types, sand land that is used for growing potatoes and vegetables with milling wheat and maize as break crops, and the heavier keuper marl.
While the soil is fairly consistent, the heavier land has lots of slopes and hollows, leading to crop variability across the fields. This is evident in both the yield maps and on the ground.
These areas have different needs for fertiliser and that is why Mr Cross is looking to vary nitrogen applications to better focus it where needed the most.
This season, he has compared two approaches in two fields of oilseed rape and two fields of wheat:
- Standard farm practice (flat rate)
- Variable rate with fields split into three different zones
His standard approach for nitrogen is 220kg/ha, plus a 20kg top up for the milling wheats to get them up to specification.
This year, the standard rate was trimmed to 200kg/ha, because of the high fertiliser price.
The maps were generated using FieldView, which uses satellite data to generate vegetative maps of each field.
Bayer’s digital activation manager Max Dafforn says that while the tool can create between two and 12 zones in each field, he recommends having three.
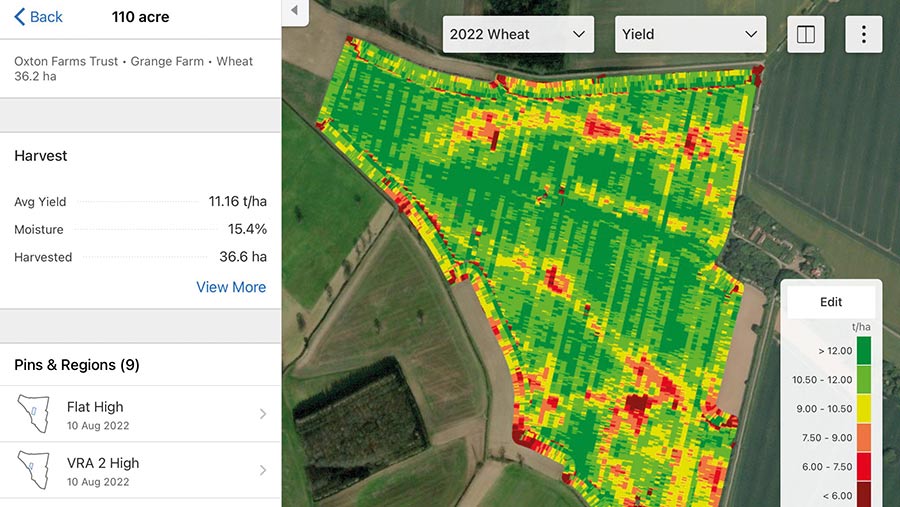
Yield map for 110 Acre © Bayer
The three zones trialled by Mr Cross are:
- Thin areas, which get 20% more nitrogen
- Average areas get the average rate
- Thick areas getting 20% less
Mr Cross used FieldView to overlay the map data taken directly from the fertiliser spreader with combine yield data to measure the impact of the three different approaches.
Oilseed rape
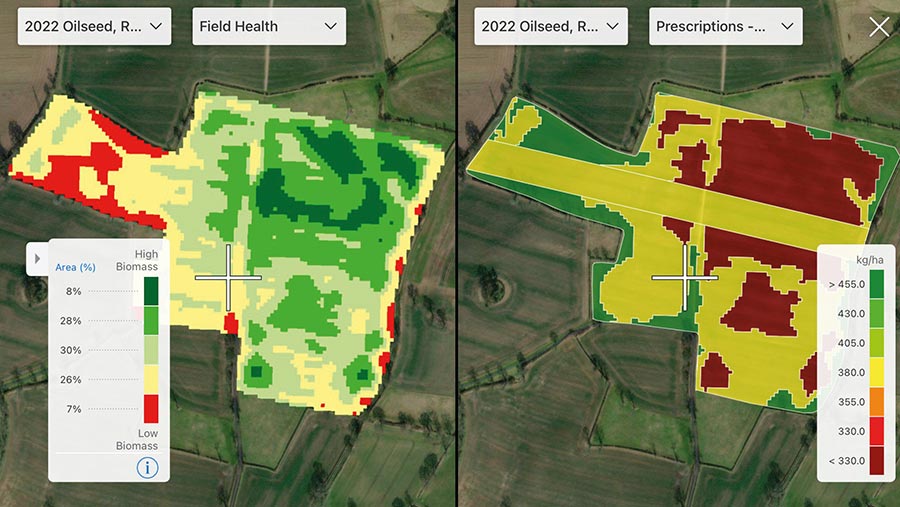
satellite image of Des Palmers © Bayer
Starting with oilseed rape, the variable rate approach in Des Palmers field delivered an extra £70.01/ha based on a 1% average yield increase and a fertiliser saving of £5.76/ha. This assumes a rapeseed price of £585/t.
However, Godsons field went the other way with a 1% yield deficit, but with a slight fertiliser saving. The result was a £53.04/ha reduction in margin against the flat rate fertiliser.
Given the size of both fields (Des Palmers 15.1ha and Godsons 16.6ha), the gain from a variable rate approach across the two was £203.57.
Wheat
Moving to wheat, the additional yield and variable rate fertiliser saving (see below) equated to £105.86/ha (based on actual fertiliser expenditure).
If Mr Cross could achieve the same uplift across his wheat area (339ha), he calculates it would be worth £35,887.
Winter wheat
- Flat rate yield average: 11.5t/ha
- Variable rate average: 11.9t/ha
- Value with wheat @£240/t: £96.00
- Flat rate fertiliser volume: 630 kg/ha
- Variable rate fertiliser volume: 595 kg/ha
On-farm trials
FieldView is proving to be a valuable tool for collecting and handling data generated by on-farm trials.
Richard Cross recalls conducting a fungicide trial last year in oilseed rape, comparing Aviator (bixafen + prothioconazole) with an azole, with a 0.3t/ha uplift in rapeseed yield.
Bayer’s digital activation manager Max Dafforn highlights that FieldView collects data directly from the sprayer to generate a treatment map, so there was no need for canes marking out the plots.
After harvest, farmers simply overlay the combine yield data to generate averages. “It takes the hassle out of running tramline trials.”
He points to another farmer running a comparison of seven different OSR varieties.
The software automatically generates a report showing the average yields for the different variety strips, by overlaying it with the drill data.
The future
Looking ahead, the estate is about to upgrade the sprayer and move to 32m tramlines, thus enabling liquid nitrogen fertiliser.
“This will make variable rate fertiliser even easier, as liquid can be applied much more accurately than solid fertiliser,” says Mr Cross.
He is also going to trial some variable rate seed trials based on the yield map data. The aim is to maintain seed rate on high yield areas and increase in lower yielding areas, with three incremental changes to a maximum of plus 15%.
What is Climate FieldView?
The tool was originally developed in the US for row crops, with the aim of making it easier for farmers to collect and use real-time cropping data, so that they can better manage and scrutinise their farming operations.
Climate FieldView is an integrated platform, bringing together data from in-season monitoring.
This includes local weather data, satellite imagery, crop biomass and water use information, as well as yield results at harvest.
At the heart is the FieldView Drive, a device that connects to the diagnostic port in the cab or equipment screen. It can be used in the combine, sprayer or drill tractor and it transfers data to the cloud.
Farmers can easily access the data via their tablets or smartphones where they can manage and interrogate the data to enable decision-making.
Richard Cross explains that it’s great to have data, but you have to be able to use it. He is using the satellite biomass data to drive his variable fertiliser maps.
This harvest will be Mr Cross’ second season collecting combine yield data on the New Holland CR8.90 with 30ft header, and he is already seeing the benefits.
He was surprised to see how badly some areas were performing yield wise and the differences within fields.
“It’s shocking to see how variable yields are.”
Some poor areas have already been identified to be taken out of production and planted with trees, as part of the estate’s stewardship.
Seeing the combine data in “real time” has also proved valuable.
“If you see there is only a hectare or two left to cut, I can go and meet the driver to tow the header to the next field, so reducing down time.
Seeing real-time yield and moisture data from the combine on his phone also helps with dryer and store management.
“I can see what’s about to come to the store and manage loads as they arrive,” he says.